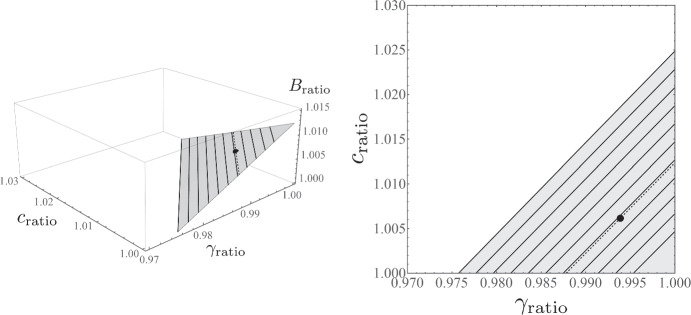
Fig. 9.
Changes in parameters Iratio,cratio, and Bratio that explain the flattening of the wage Phillips curve between Periods I and II, given Eq. (20). The left-hand panel shows the surface that the solution covers, with the solid lines for Bratio = 1,1.001,1.002⋯ ,1.01, a black sphere for the case in which c,B, and γ are changed simultaneously at a similar level as explained in the text (see Eq. (20)), and the dashed line for the required value of change in B (Bratio = 1.00616). The right-hand panel is the projection onto the (γratio,cratio)-plane

