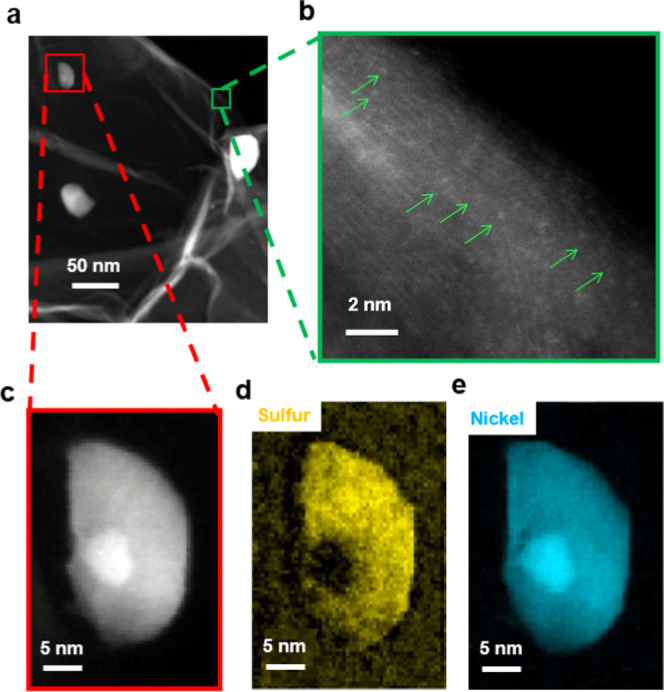
Figure 2.

Analysis of the Ni–N–C-low sample by transmission electron microscopy and electron energy loss spectroscopy mapping. (a) Lower-resolution high-angle annular dark-field (HAADF) scanning transmission electron microscopy (STEM) image. (b) Higher-resolution HAADF-STEM image showing graphitic planes, with individual bright (high Z-number) atoms indicated by green arrows. (c) STEM image of a particle showing a core–shell structure. STEM electron energy loss spectroscopy (EELS) mapping of (d) sulfur and (e) nickel in this particle.
