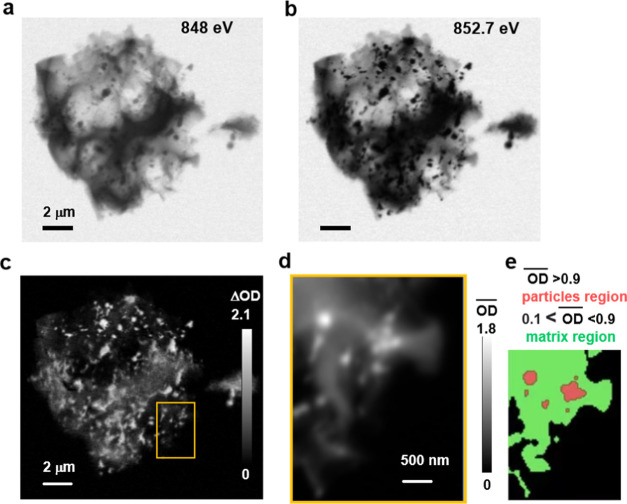
Figure 3.
STXM analysis of a Ni–N–C-high structure (A1 region). (a) Transmission image at 848 eV (Ni 2p pre-edge). (b) Transmission image at 852.7 eV (Ni 2p3/2 peak). (c) Difference in the optical density, ΔOD = OD852.7 – OD848. (d) Average of 143 OD images (Ni 2p stack) recorded in the A1a region (yellow rectangle in (c)). (e) Masks used to select spectra of the particles (light red) and matrix (light green).

