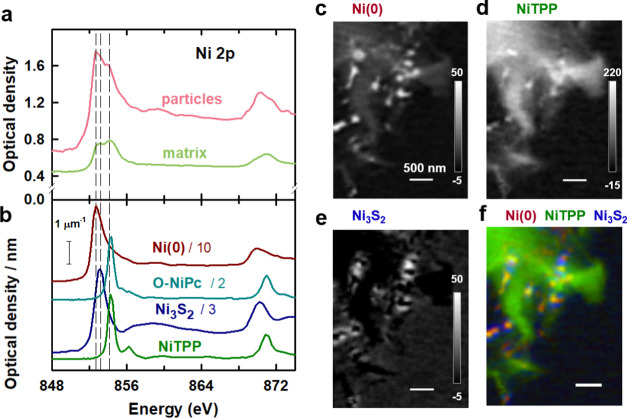
Figure 4.
Analysis of the Ni 2p stack of region A1a of the Ni–N–C-high sample. (a) Ni 2p X-ray absorption spectra (XAS) of the particles and the carbonaceous matrix of region A1a of the Ni–N–C-high sample. (b) XAS spectra of Ni(0) NiTPP, O-NiPc, and Ni3S2 on absolute optical density (OD1) scales. Note the scaling used to optimize the visibility of the spectral features. Quantitative component maps of (c) Ni(0), (d) NiTPP, and (e) Ni3S2 derived from an SVD fit. The grayscale indicates the thickness based on the use of absolute OD1 reference spectra. (f) Rescaled color-coded composite of the Ni(0) (dark red), NiTPP (dark green), and Ni3S2 (dark blue) component maps.

