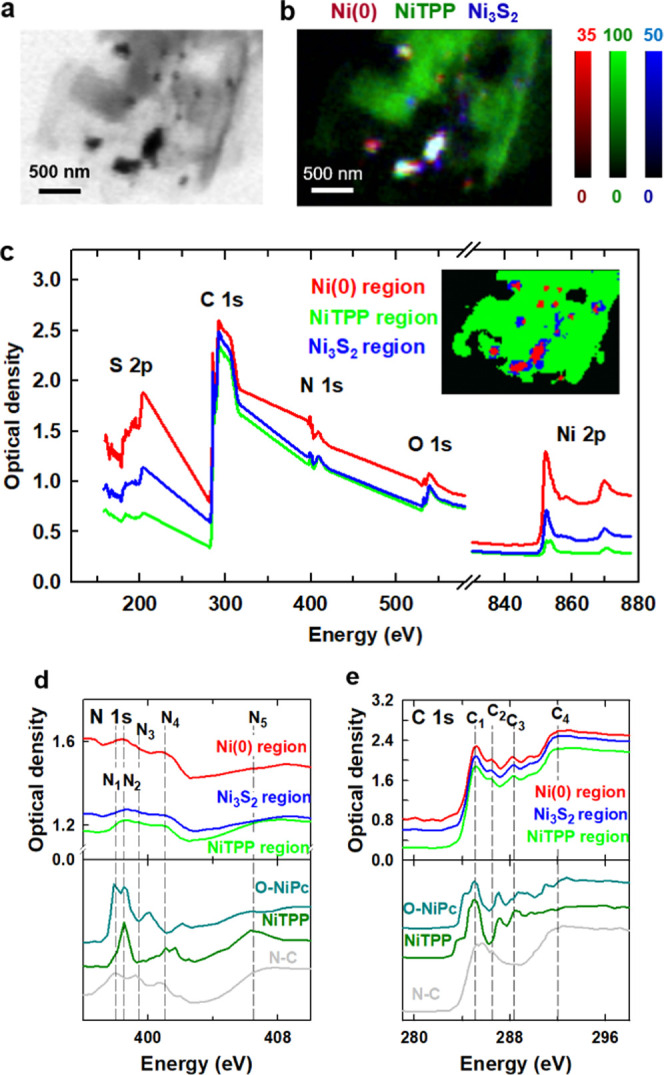
Figure 5.

Ni 2p, N 1s, and C 1s results for region A2 of the Ni–N–C-high sample. (a) STXM transmission image at 852.7 eV. (b) Rescaled color-coded composite of the Ni(0) (dark red), NiTPP (dark green), and Ni3S2 (dark blue) component maps derived by a fit of the spectra displayed in Figure 4b to a Ni 2p stack. (c) S 2p, C 1s, N 1s, O 1s, and Ni 2p spectra of Ni(0), NiTPP, and Ni3S2 regions. The areas from Ni(0) (red), NiTPP (green), and Ni3S2 (blue) regions were generated are indicated in the inset. (d) N 1s spectra of the Ni(0), NiTPP, and Ni3S2 regions compared to the N 1s spectra of O-NiPc, NiTPP, and N–C (Ni-free catalyst). (e) C 1s spectra of the Ni(0), NiTPP, and Ni3S2 regions compared to the C 1s spectra of O-NiPc, NiTPP, and N–C (Ni-free).
