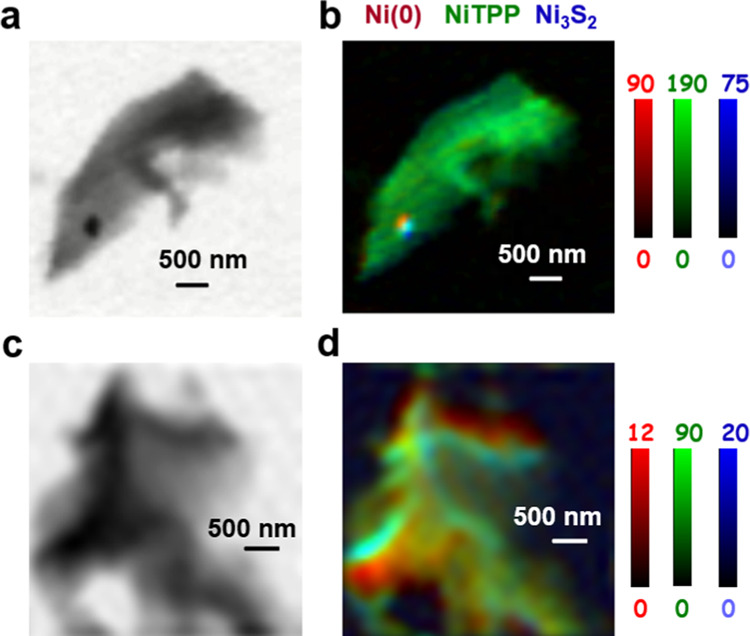
Figure 6.

Results for Ni 2p analysis of regions B1 and B2 of the Ni–N–C-low sample. (a) STXM transmission image at 852.7 eV of region B1. (b) Rescaled color-coded composite of the Ni(0) (dark red), NiTPP (dark green), and Ni3S2 (dark blue) component maps for region B1. (c) STXM transmission image at 852.7 eV of region B2. (d) Rescaled color-coded composite for B2.
