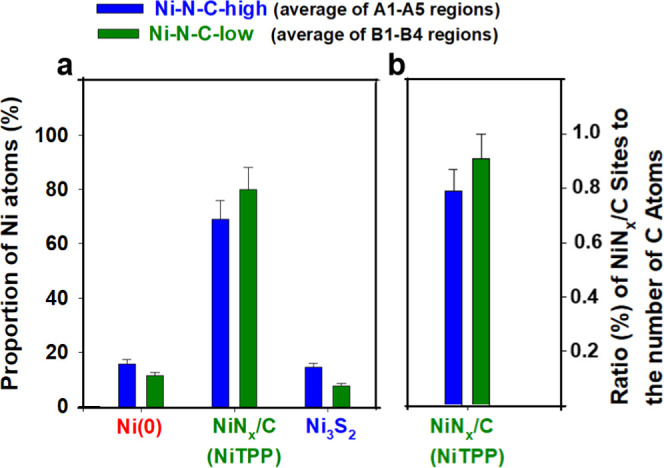
Figure 7.

Group bar chart representing the quantitative distribution of different Ni-sites averaged over the five regions of the Ni–N–C-high and four regions of the Ni–N–C-low sample. (a) Total proportion of Ni atoms (out of all the Ni atoms in the sample) present in the domains shown on the x-axis, for both catalysts investigated. (b) Ratio of the total number of NiNx/C sites present in the catalyst divided by the total number of carbon atoms present in the catalyst, providing a quantitative gauge of NiNx/C species concentration. Values are averaged over the five regions of the Ni–N–C-high and four regions of the Ni–N–C-low sample. The error bars take into account statistical and estimated systematic uncertainties.
