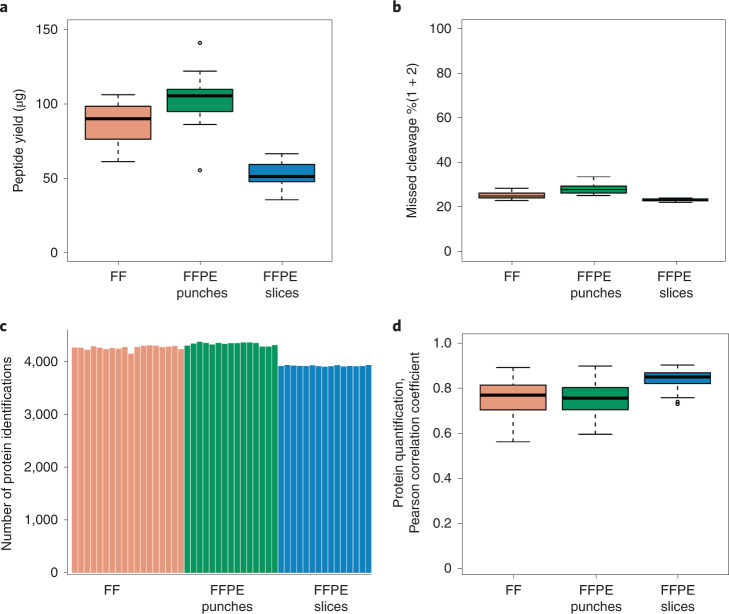
Fig. 3. Demo analysis of mouse kidney tissue samples.
a, Peptide yield of 18 FF, 15 FFPE punch (0.8–1.2 mg for each sample) and 15 FFPE slice (20 µm) mouse kidney samples. b, Percentages of peptides with one and two missed cleavages. c, Number of protein identifications for each tissue sample with 500 ng peptide injection. d, Pearson correlation coefficient (r) of proteins quantified by Proteome Discoverer v2.5.0.400 with high protein FDR confidence.

