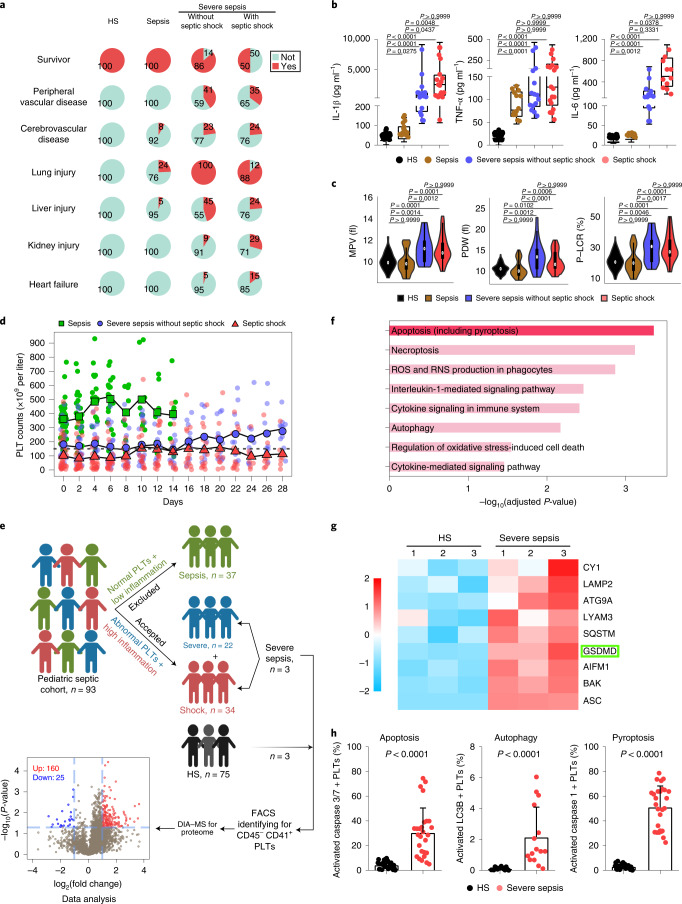
Fig. 1. Cohort features and proteomic analysis of septic platelets.
a, Pie charts showing mortality and complications in the HS (n = 75) and sepsis groups (sepsis, n = 37; severe sepsis without septic shock, n = 22; septic shock, n = 34). b, Boxplots showing the levels of IL-1β (HS, n = 53; sepsis, n = 15; severe sepsis without septic shock, n = 17; septic shock, n = 17), TNF-α (HS, n = 53; sepsis, n = 13; severe sepsis without septic shock, n = 15; septic shock, n = 18) and IL-6 (HS, n = 53; sepsis, n = 15; severe sepsis without septic shock, n = 14; septic shock, n = 11). The boxes indicate the 25% quantile, median and 75% quantile. c, Violin plots showing the platelet parameters: mean platelet volume (HS, n = 75; sepsis, n = 37; severe sepsis without septic shock, n = 21; septic shock, n = 31); platelet distribution width (PDW) (HS, n = 73; sepsis, n = 37; severe sepsis without septic shock, n = 21; septic shock, n = 30); and high platelet large cell ratio (P-LCR) (HS, n = 75; sepsis, n = 37; severe sepsis without septic shock, n = 21; septic shock, n = 31) among sepsis groups. d, Scatterplots showing platelet counts for sepsis, severe sepsis without septic shock and septic shock patients along the time (28 d) axis (sepsis, n = 37; severe sepsis without septic shock, n = 21; septic shock, n = 30). The dotted line indicates the lower limit of platelet counts for HS (150 × 109 to 399 × 109 per liter). e, Schematic diagram of the experimental design for DIA-MS (HS, n = 3; severe sepsis, n = 3). Volcano plot with significantly increased (red) and decreased (blue) expression of proteins from the HS and sepsis groups. Fold change cutoff >2 and P value <0.05. f, Bar plots of the enriched GO biological processes, KEGG or Reactome terms of highly expressed genes from sepsis groups. g, Heatmap of representative proteins related to different cell death signal pathways in severe sepsis (with or without septic shock) and HS samples. h, Bar graphs displaying the percentage activation of caspase 3/7 (HS, n = 27; severe sepsis, n = 27), LC3B (HS, n = 15; severe sepsis, n = 15) and caspase 1 (HS, n = 27; severe sepsis, n = 27) in septic and HS platelets using FACS. Data were presented as mean ± s.d. or median with interquartile range. Statistical analysis was conducted using Kruskal–Wallis test and Dunn’s multiple comparisons test (b,c), and two-tailed Mann–Whitney test (h). PLT, platelet.

