Figure 2.
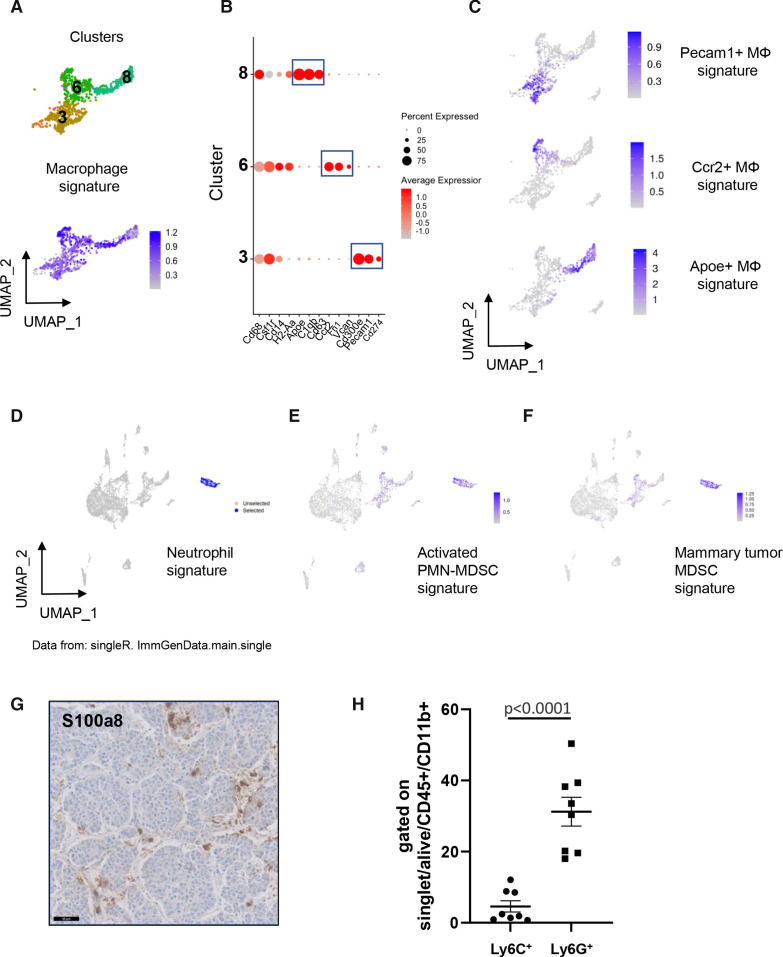
Macrophage heterogeneity and myeloid-derived suppressor cells (MDSCs) in TH-MYCN mouse tumors. (A) Uniform manifold approximation and projection (UMAP) analysis uncovers three different clusters of macrophages (top) expressing a common signature (bottom). (B) Dotplot showing the expression of marker genes highlighting the differences between three macrophage subsets. (C) Expression of the signatures of the three macrophage subsets. (D) SingleR identifies cluster 5 cells as neutrophils. (E) and (F) cluster 5 cells are highlighted by a signature of activated PMN-MDSCs29 and a signature of mammary tumor MDSCs.31 (G) Representative image of the staining of S100A8 by IHC obtained on the same tumor as the one showed in figure 1D. Scale bar: 50 µm. (H) Percentage of cells expressing Ly6C and Ly6G by FACS among CD45+CD11b+ cells in 8 TH-MYCN tumors. FACS, multicolor flow cytometry; IHC, immunohistochemistry; PMN, polymorphonuclear neutrophils.

