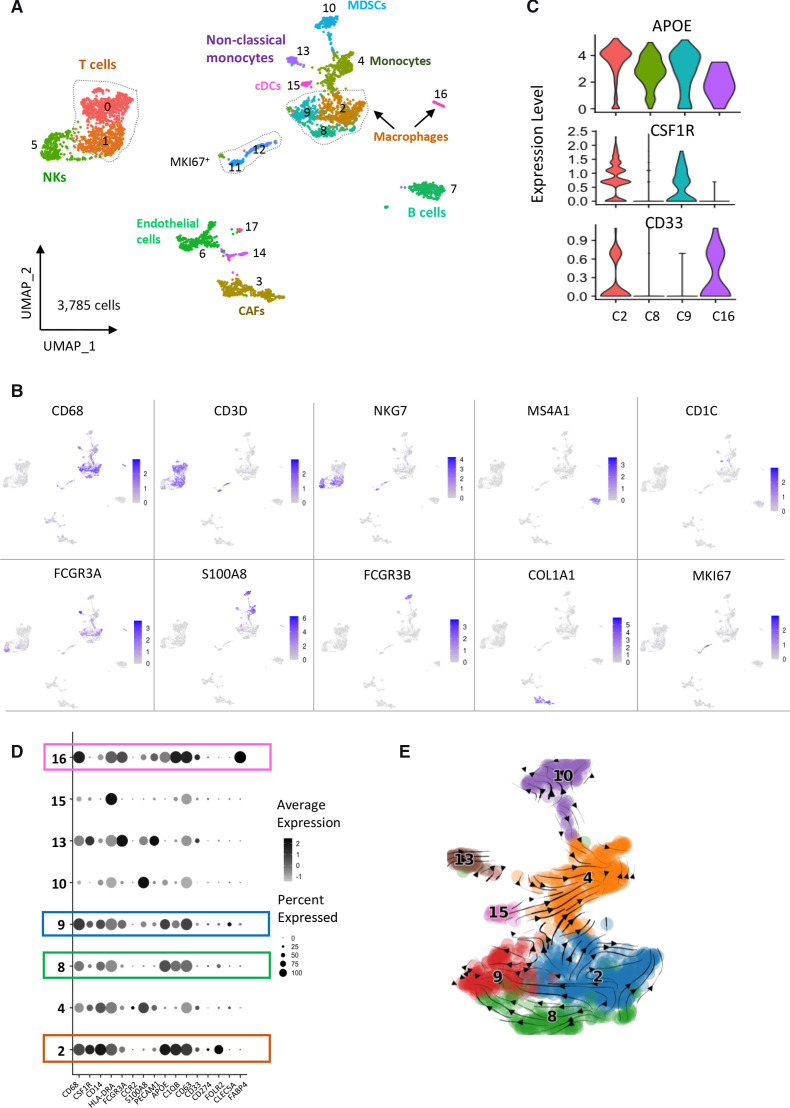
Figure 3.
Characterization of the TME in a cohort of 10 neuroblastoma biopsies by single-cell transcriptomic analysis. (A) UMAP of 3785 cells obtained after the integration of the 10 biopsies and clustering of non-tumor cells only. Tumor cells were defined by the expression of PHOX2B and presence of genomic alterations inferred from scRNA-seq data. (B) Cell types were determined by canonical marker genes. (C) Violin plots showing the expression of APOE, CSF1R and CD33 that defines three different macrophages subsets. (D) Dotplot showing the expression of genes defining the different myeloid cell populations. (E) scVelo analysis indicating that macrophages from clusters 8 and 9 likely derive from macrophages of cluster 2. CAFs, cancer-associated fibroblasts; TME, tumor microenvironment; UMAP, uniform manifold approximation and projection.

