Figure 2:
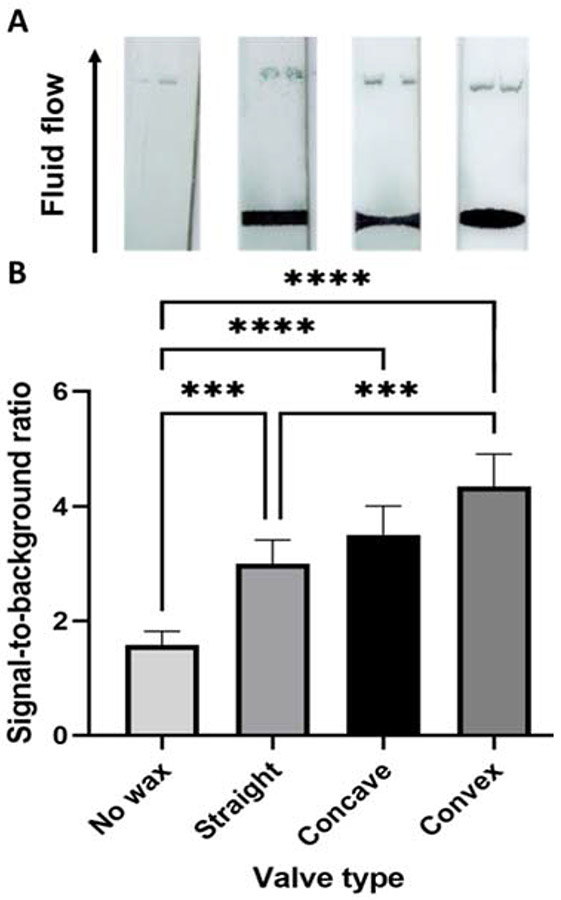
A. Representative images of LFIAs without a wax valve and with straight, concave, and convex valves. B. Signal-to-background ratio for test spot signal 1 cm past the valve location. Error bars represent standard deviation. A one-way ANOVA was performed on this dataset. ***=p< 0.01, **** indicates p<0.001

