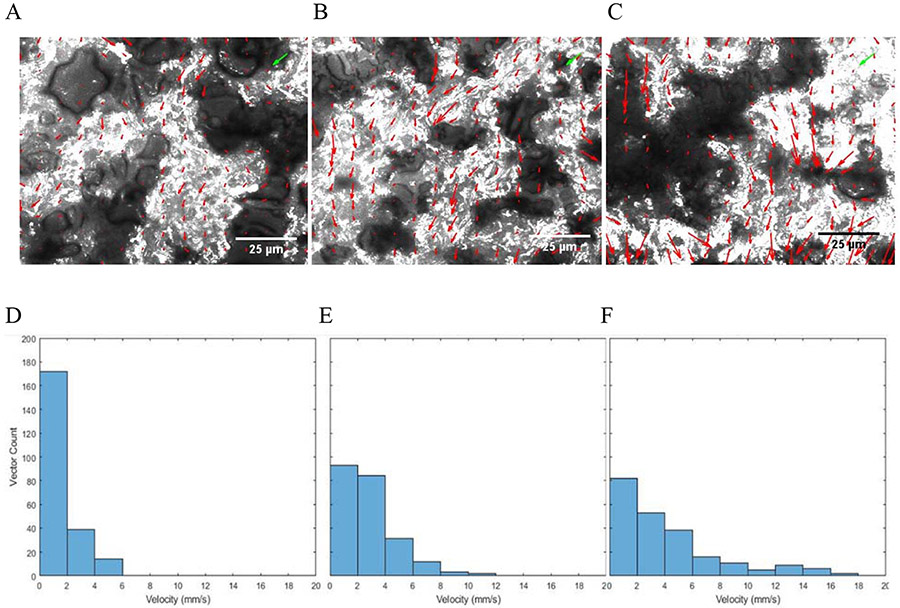
Figure 3:
μPIV analyses of flow through nitrocellulose. A-C. Composites of 400 images from a 10 second time series taken 10 (A), 15 (B), and 20 (C) mm from the sample pad in the center of the membrane combined into a single image to display locations of visible particles, with an overlaying vector field from EDPIV analysis (red arrows; green arrow represents the length of a 1 mm/s velocity vector in both the x and y directions). D-F. Histogram reflecting the velocity distribution of all 225 vectors of each above analysis.

