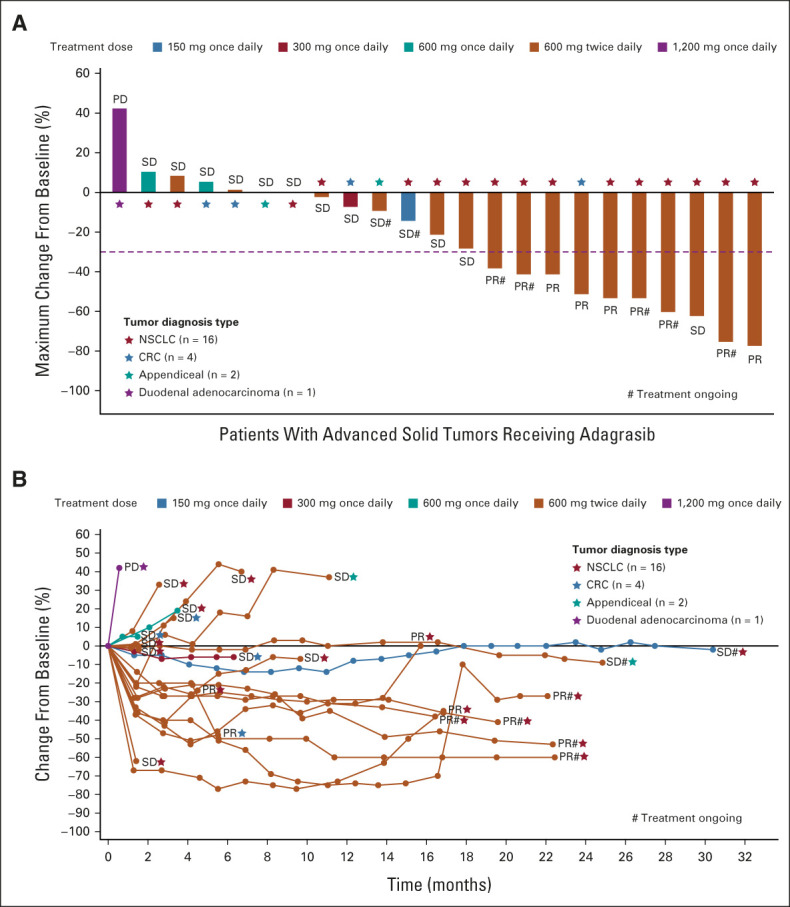
FIG 3.

(A) Waterfall plot depicting the best tumor change from baseline. (B) Spider plot depicting the change in tumor measurement over time. Clinical activity evaluable population, n = 24; one patient (NSCLC, treated with 600 mg twice a day) was not included due to having no target lesion; therefore, change from baseline cannot be calculated. Data cutoff date: August 15, 2021. CRC, colorectal cancer; NSCLC, non–small-cell lung cancer; PD, progressive disease; PR, partial response; SD, stable disease.
