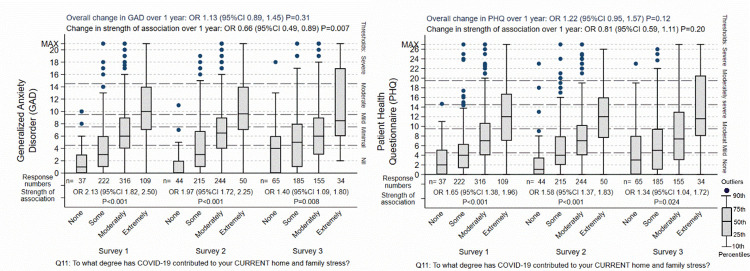
Fig 4. Effect of home / family stress on GAD-7 and PHQ-9.
The “Overall change over 1 year” is the background outcome scale O.R. for change in the respondents not explained by the predictor variable included in the regression models. The “Change in strength of association” is the O.R. for the change of the association of the specific predictor shown in the graph over 1 year, adjusted for the other predictors in the regression models. The box-plots display the group score distributions without adjustment for other predictors. The number of specific responses to the questions are shown at each response and survey period. The “Strength of association” is the association of between the outcome and predictor at each survey period.

