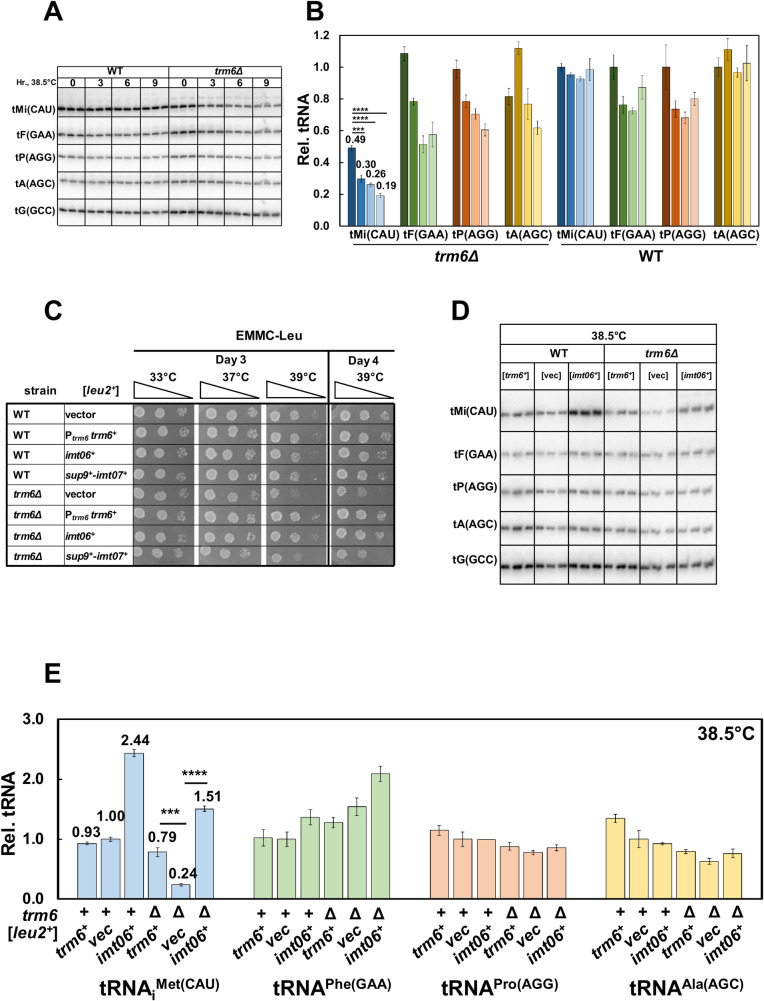
Fig 2. S. pombe trm6Δ temperature sensitivity is associated with reduced tRNAiMet(CAU) levels.
(A) Northern analysis of tRNAs in S. pombe trm6Δ and WT cells before and after shift from 30°C to 38.5°C. Strains were grown in YES media at 30°C, shifted to 38.5°C for 9 hours as described in Materials and Methods, and RNA was isolated at the indicated times, and analyzed by northern blotting, with probes as indicated. tMi(CAU), tRNAiMet(CAU); tF(GAA), tRNAPhe(GAA); tP(AGG), tRNAPro (AGG); tA(AGC), tRNAAla(AGC); tG(GCC), tRNAGly(GCC). (B) Quantification of tRNA levels in S. pombe trm6Δ and WT cells at 30°C and 38.5°C. The bar chart depicts relative levels of tRNA species at each temperature, relative to their levels in the WT strain at 30°C (each itself first normalized to levels of the control tG(GCC)). For each tRNA, the dark shade indicates 30°C, and progressively lighter shades indicate time points (3, 6, 9 hours) Standard deviations for each tRNA measurement are indicated. The statistical significance of tRNA levels was evaluated using a two-tailed Student’s t-test assuming equal variance. ns, not significant; *, p < 0.05; **, p < 0.01; ***, p < 0.001; ****, p<0.0001. tMi(CAU), blue; tF(GAA), green; tP(AGG), orange; tA(AGC), yellow. (C) Overproduction of tRNAiMet(CAU) suppresses the ts growth defects of S. pombe trm6Δ mutants. Strains with plasmids as indicated were grown overnight in EMMC-Leu media at 30°C and analyzed for growth as in Fig 1A on indicated plates and temperatures. (D) Overproduction of tRNAiMet(CAU) restores tRNAiMet(CAU) levels in S. pombe trm6Δ mutants. Strains containing plasmids as indicated were grown in EMMC-Leu at 30°C and shifted to 38.5°C for 8 hours as described in Materials and Methods, and RNA from cells grown at 38.5°C was isolated and analyzed by northern blotting as in Fig 2A. (E) Quantification of tRNA levels in S. pombe trm6Δ mutants and WT strains overproducing tRNAiMet(CAU). tRNA levels were quantified as in Fig 2B.

