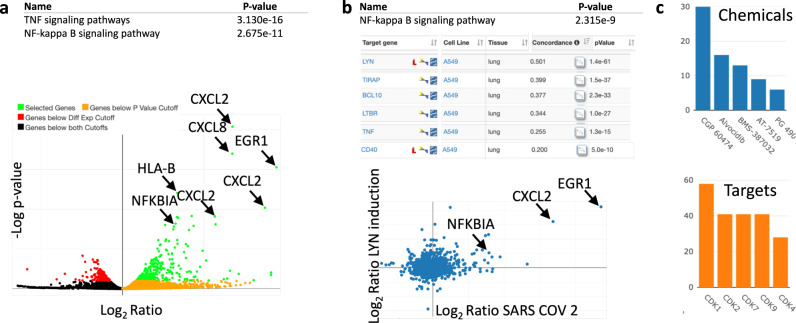
Fig. 7. SARS-Cov-2 infection of A549 cells expressing ACE2.
a Upregulated genes (unadjusted, two-tailed P value < 10−10) in top two enriched KEGG pathways (unadjusted Fisher exact test P values shown in the table). b Top KEGG pathway in the enrichment analysis (unadjusted Fisher exact test P values shown in the table) of signatures of gene overexpression mimicking infection in the A549 cell line. The list of six most positively correlated overexpression signatures (unadjusted, two-tailed weighted correlation P values are shown in the table) and the scatter plot of the LYN overexpression signature against the SARS Cov-2 infection signature. c Chemicals reversing the infection signatures and their protein targets.

