
Fig 4:
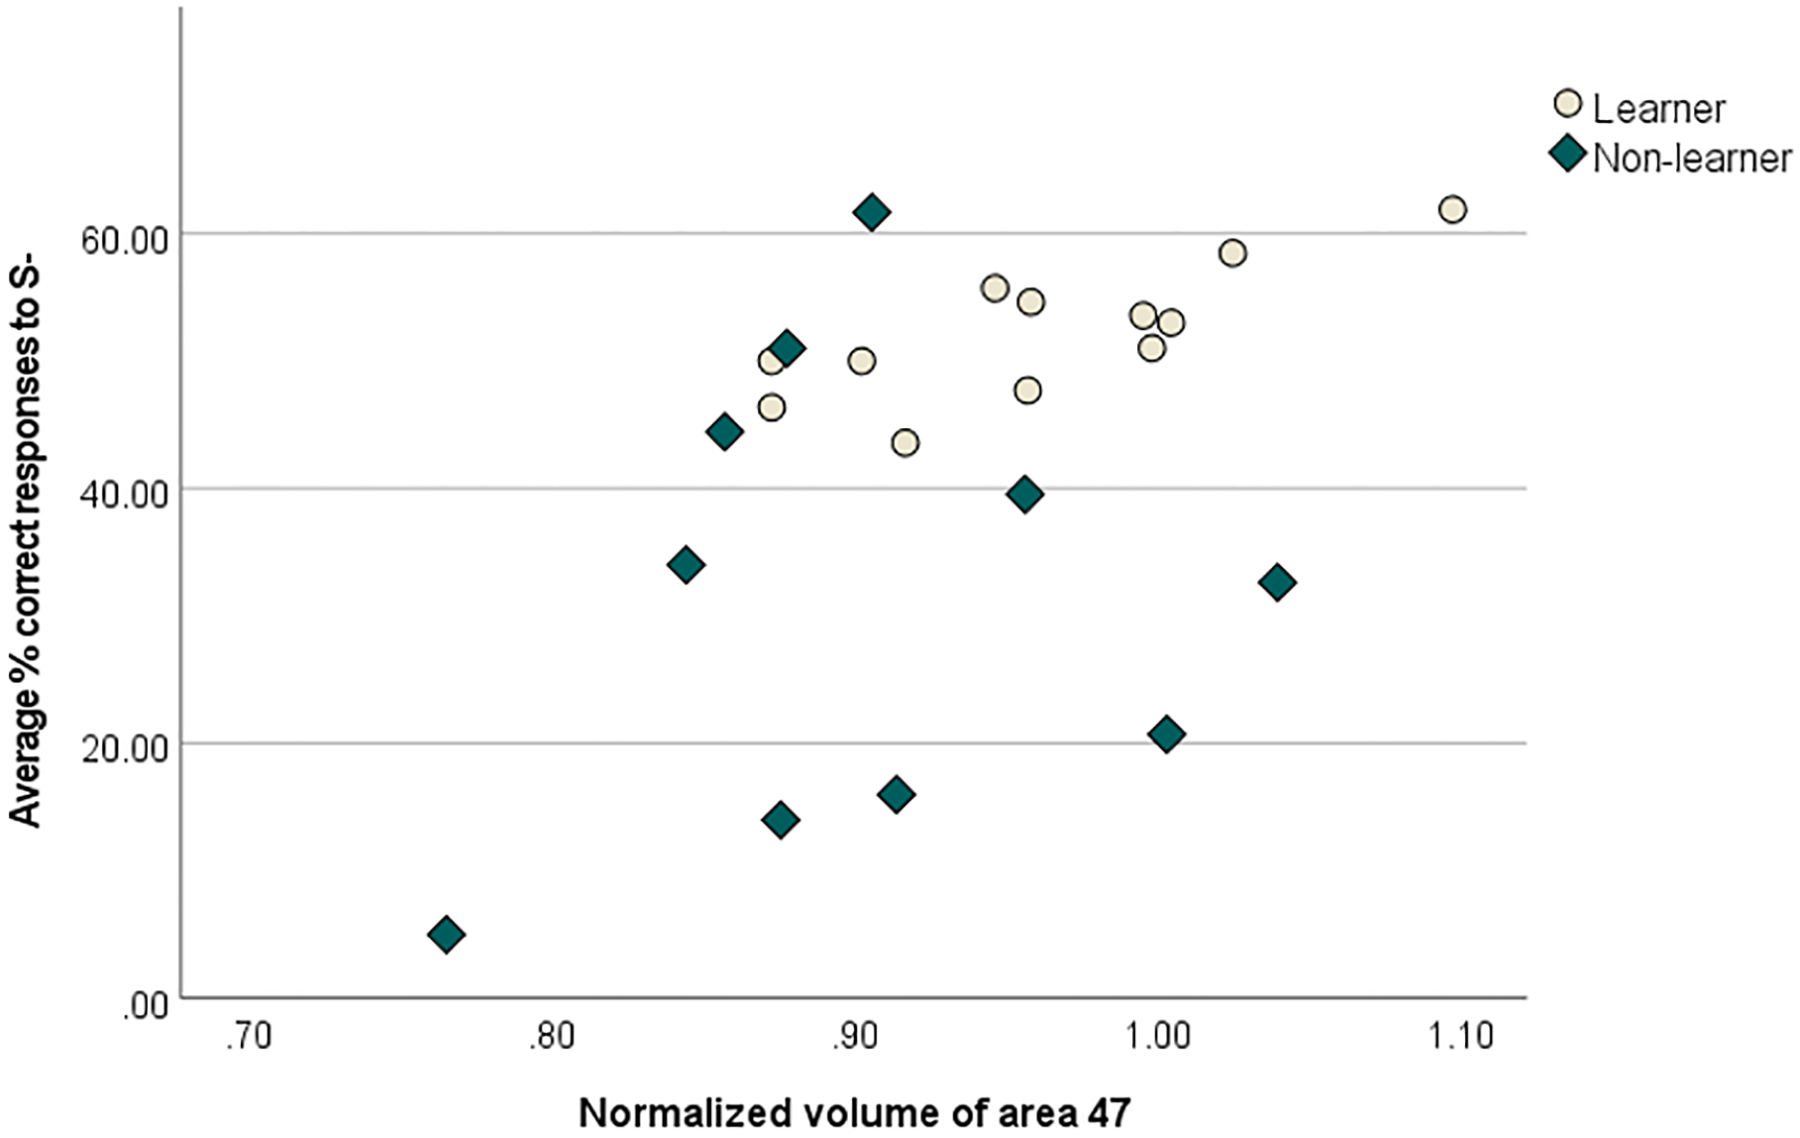
Significant (p<0.05) positive Spearman’s rank correlation between average % correct responses to S− (the ‘punished’ stimulus) in a visual discrimination task and normalized volume of area 47 (an orbitofrontal/ventrolateral region) (n=22; 12 learners, 10 non-learners). Larger volumes were associated with greater average correct responses to S−.