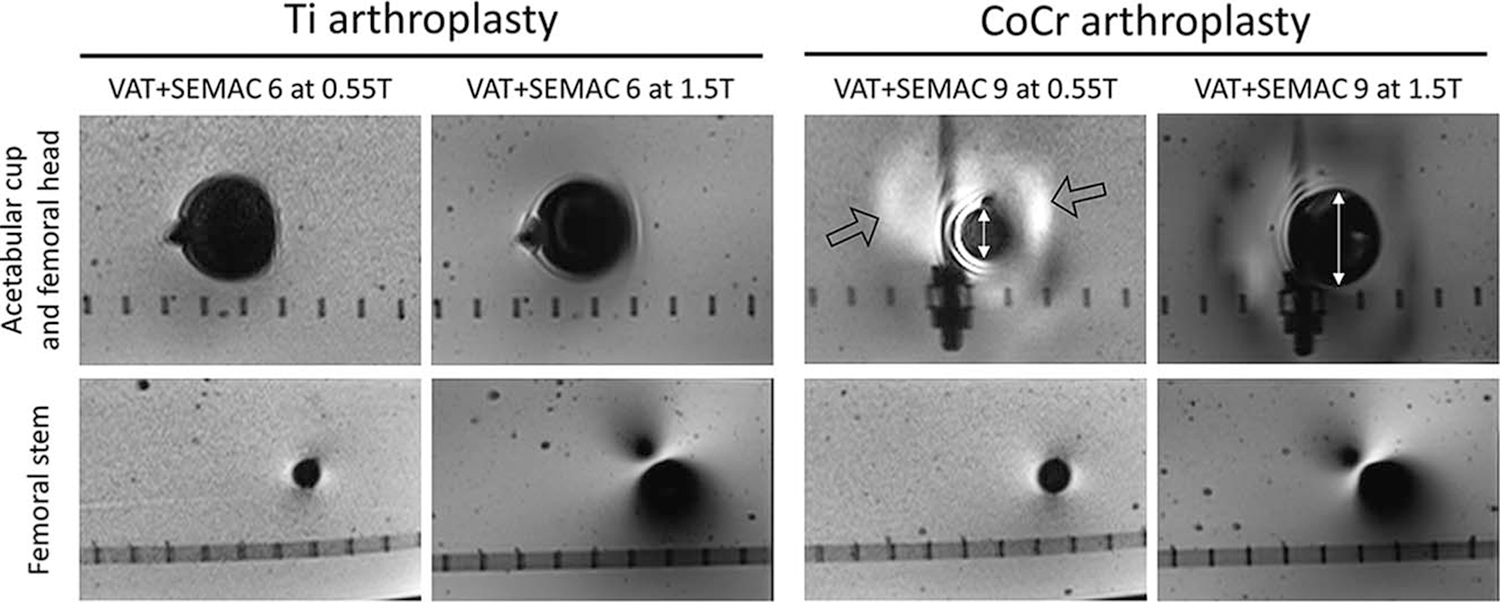
FIGURE 6.

Comparison of the 0.55 T and 1.5 T images using matched protocols at the implant head and femoral stem levels to visualize field strength effects on B0- and B1-related artifacts. B0-related areas of signal loss at the regions of the acetabular cup and femoral head (white line with arrows near the CoCr acetabular cup) are smaller at 0.55 T, while there are new areas of signal pileup at 0.55 T (hollow arrows). For both Ti and CoCr implants, the B1-related artifacts are substantially smaller surrounding the femoral stem.
