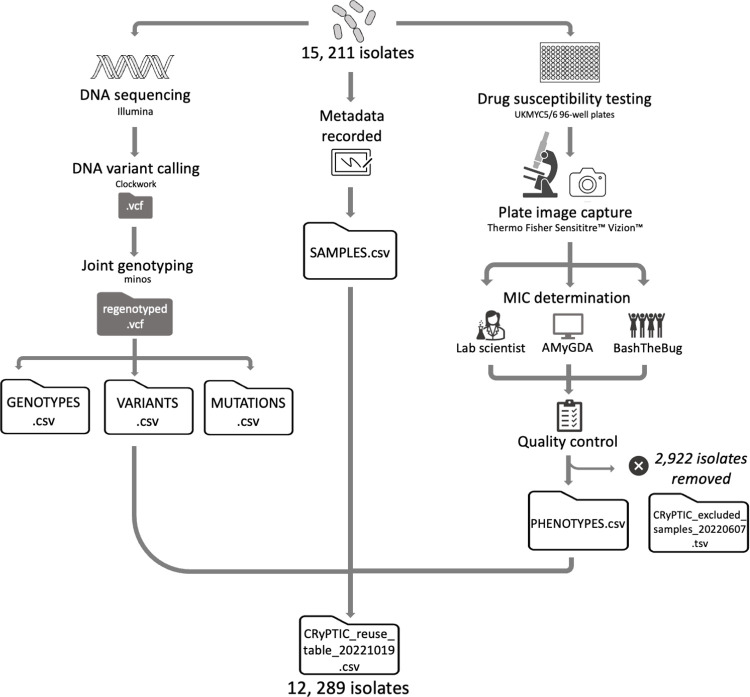
Fig 1. Processing sequencing and minimum inhibitory concentration data for 15,211 Mycobacterium tuberculosis isolates (“full” dataset).
Briefly: Each isolate was DNA sequenced using an Illumina machine and plated onto 96-well plates (UKMYC5/6) containing 5–10× doubling dilutions of 13 antitubercular drugs for DST. Associated metadata (including country of origin and processing laboratory) was recorded. DNA variant calling and analysis was performed using Clockwork and Minos [47]). After 14 days, MIC measurements were taken by a trained scientist using Vizion, and the plate was photographed to also measure the MIC using the automated AMyGDA software and citizen scientists from BashTheBug [45]. After quality control procedures, phenotypic MIC data for 2,922 isolates were removed. The compendium therefore contains 15,211 isolates with WGS data (“full dataset”), 12,289 of which have matched quality assessed phenotypic data (“data compendium”). The raw sequence, VCFs, MICs, and binary resistance calls for the data compendium are presented in “CRyPTIC_reuse_table_20211019.csv” via an FTP site (see Methods), and the raw sequence and VCF files for those samples present in the full dataset are presented in “CRyPTIC_excluded_samples_20220607.tsv” via the same FTP site (see Methods). The data tables GENOTYPES.csv, VARIANTS.csv, MUTATIONS.csv, SAMPLES.csv, and PHENOTYPES.csv used for the analyses presented in this manuscript are also accessible via the FTP site (see Methods). DST, drug susceptibility testing; MIC, minimum inhibitory concentration; WGS, whole-genome sequencing.

