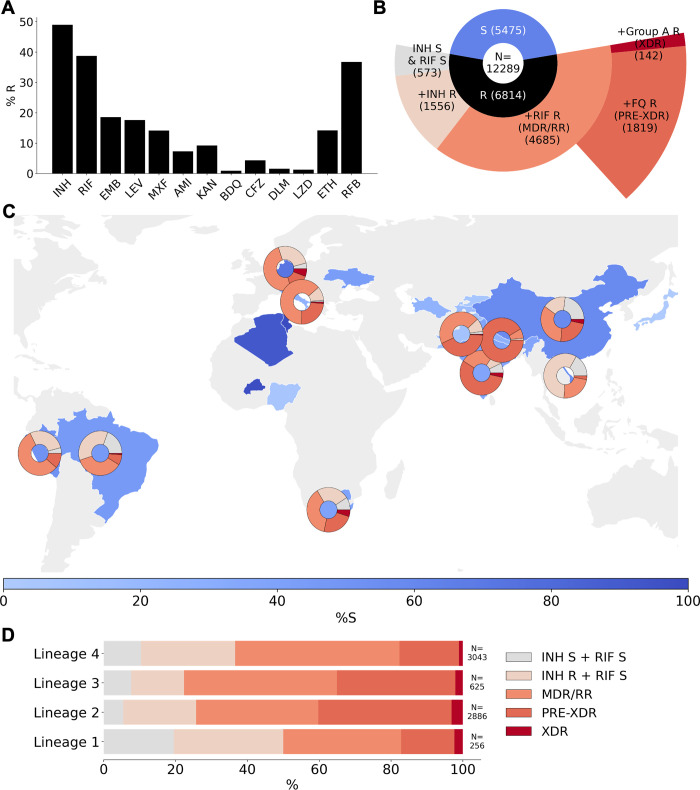
Fig 3. Drug phenotype data for the CRyPTIC compendium.
(A) Frequency of resistance to each of 13 drugs in the data compendium. The total number of isolates with a binary phenotype (of any quality) for the corresponding drug is presented in Table 1. (B) Phenotypes of the 12,289 isolates with a binary phenotype for at least 1 drug. (C) Geographical distribution of phenotypes of 12,289 compendium isolates. Intensity of blue shows the percentage of isolates contributed that were categorised as susceptible to all 13 drugs (“%S”). Donut plots show the proportions of resistant phenotypes identified in (B) for countries contributing > = 100 isolates with drug resistance. (D) Proportions of resistance phenotypes in the 4 major Mycobacterium tuberculosis lineages. N is the number of isolates of the lineage called resistant to at least one of the 13 drugs. The base layer map in (C) was sourced from Natural Earth, which is in the public domain (see http://www.naturalearthdata.com/about/terms-of-use/), and created using the python library “geopandas” (see github.com/kerrimalone/Brankin_Malone_2022/). AMI, amikacin; BDQ, bedaquiline; CFZ, clofazimine; CRyPTIC, Comprehensive Resistance Prediction for Tuberculosis: an International Consortium; DLM, delamanid; EMB, ethambutol; ETH, ethionamide; INH, isoniazid; KAN, kanamycin; LEV, levofloxacin; LZD, linezolid; MDR, multidrug resistant; MXF, moxifloxacin; pre-XDR, pre-extensively drug resistant; RFB, rifabutin; RIF, rifampicin; RR, rifampicin resistant; XDR, extensively drug resistant.

