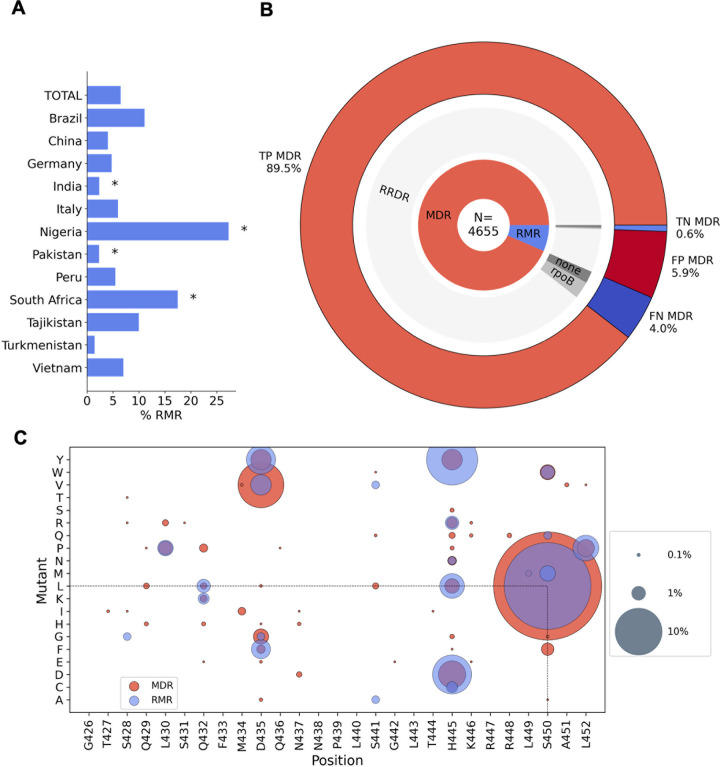
Fig 6. Rifampicin monoresistance.
(A) Percentage of RR isolates that are RMR by country of isolate origin. * indicates RMR proportions that were significantly different from that of the total dataset using a 2-tailed z-test with 95% confidence. (B) MDR predictions for RR isolates made using the Xpert MTB/RIF assay proxy. N is the total number of RR isolates. The inner ring shows the proportion of RR isolates that are RMR and MDR. The middle ring represents the proportions of RMR and MDR isolates that have an SNP (synonymous or nonsynonymous) in the RRDR of rpoB (“RRDR”), no RRDR SNP but a SNP elsewhere in the rpoB gene (“rpoB”), and no rpoB mutations (“none”). The outer ring shows the expected TP, TN, FP, and FN MDR predictions of Xpert MTB/RIF assay, based on the SNPs present in the RR isolates. (C) Nonsynonymous mutations found in the RRDR of rpoB in RMR isolates and MDR isolates. Presence of a coloured spot indicates that the mutation was found in RMR/MDR isolates, and spot size corresponds to the proportion of RMR or MDR isolates carrying that mutation. FN, false negative; FP, false positive; MDR, multidrug resistant; RRDR, rifampicin resistance–determining region; RMR, rifampicin monoresistant; RR, rifampicin resistant; SNP, single nucleotide polymorphism; TN, true negative; TP, true positive.

