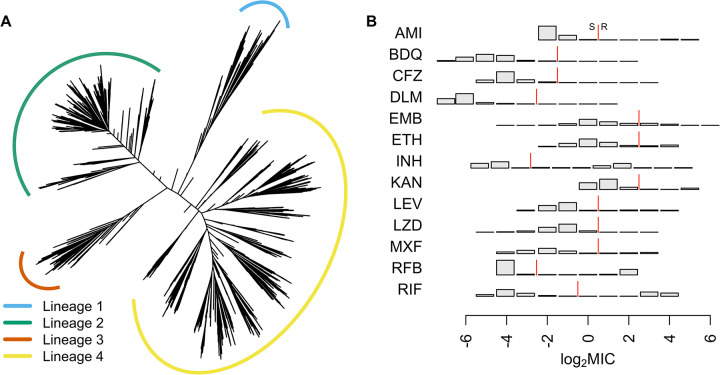
Fig 1.
(A) Phylogeny of 10,228 isolates sampled globally by CRyPTIC used in the GWAS analyses. Lineages are coloured blue (lineage 1), green (2), orange (3), and yellow (4). Branch lengths have been square root transformed to visualise the detail at the tips. (B) Distributions of the log2 MIC measurements for all 13 drugs in the GWAS analyses, AMI, BDQ, CFZ, DLM, EMB, ETH, INH, KAN, LEV, LZD, MXF, RFB, and RIF. The red line indicates the ECOFF breakpoint for binary resistance versus sensitivity calls [31]. AMI, amikacin; BDQ, bedaquiline; CFZ, clofazimine; DLM, delamanid; ECOFF, epidemiological cutoff; EMB, ethambutol; ETH, ethionamide; INH, isoniazid; KAN, kanamycin; LEV, levofloxacin; LZD, linezolid; MIC, minimum inhibitory concentration; MXF, moxifloxacin; RFB, rifabutin; RIF, rifampicin.

