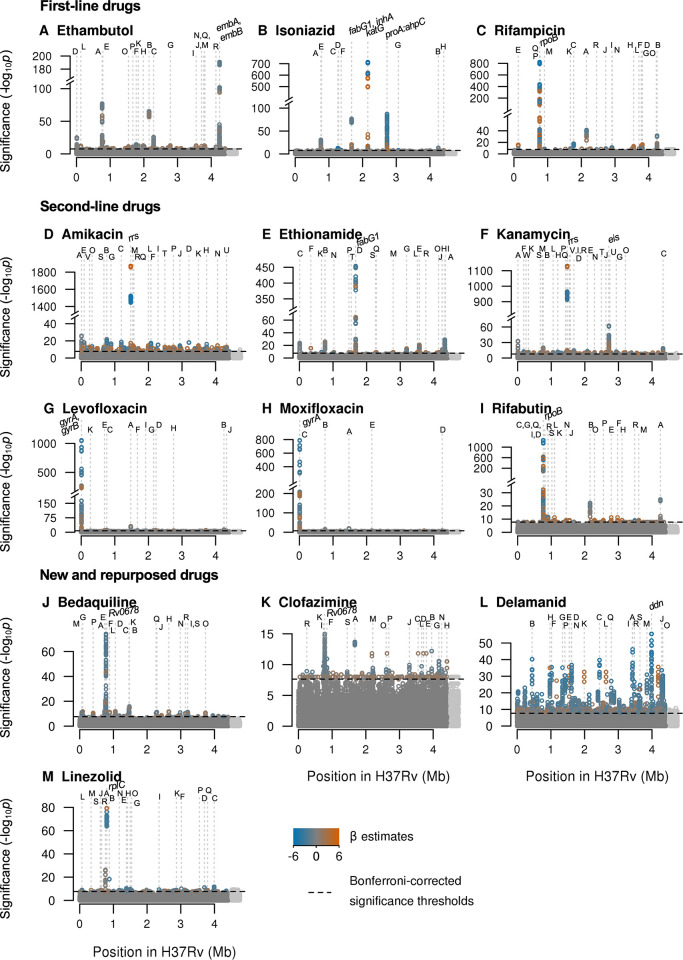
Fig 3. Manhattan plots of regions containing oligopeptide variants associated with MIC across 13 drugs.
Significant oligopeptides are coloured by the direction (orange = increase, blue = decrease) and magnitude of their effect size on MIC, estimated by LMM [32]. Bonferroni-corrected significance thresholds are shown by the black dashed lines. The top 20 genes ranked by their most significant oligopeptides are annotated alphabetically. Gene names separated by colons indicate intergenic regions. Gene names for those annotated with letters can be found in Table 1. Oligopeptides were aligned to the H37Rv reference; unaligned oligopeptides are plotted to the right in light grey. LMM, linear mixed model; MIC, minimum inhibitory concentration.

