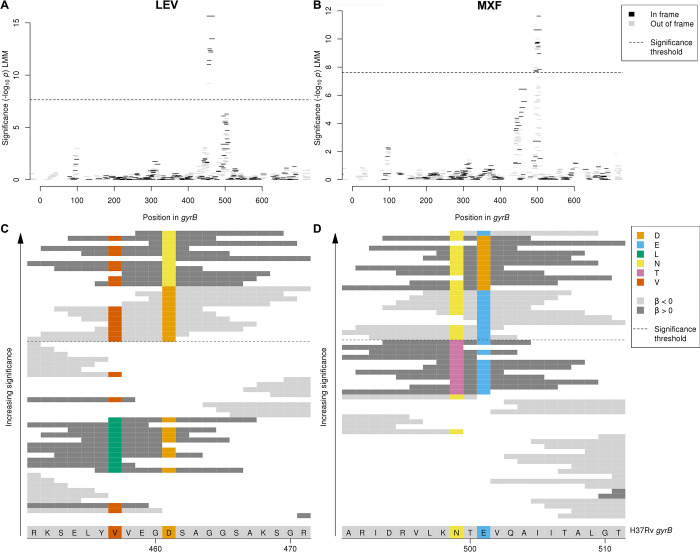
Fig 4. Interpreting significant oligopeptide variants for levofloxacin and moxifloxacin MIC in gyrB.
Oligopeptide Manhattan plots are shown for (A) levofloxacin and (B) moxifloxacin. Oligopeptides are coloured by the reading frame that they align to, black for in frame and grey for out of frame in gyrB. Oligopeptides aligned to the region by nucmer but not realigned by BLAST are shown in grey on the right-hand side of the plots. The black dashed lines indicate the Bonferroni-corrected significance thresholds—all oligopeptides above the line are genome-wide significant. Alignment is shown of oligopeptides significantly associated with (C) levofloxacin and (D) moxifloxacin. The H37Rv reference codons are shown at the bottom of the figure, grey for an invariant site, coloured at variant site positions. The background colour of the oligopeptides represents the direction of the β estimate, light grey when β < 0 (associated with lower MIC), dark grey when β> 0 (associated with higher MIC). Oligopeptides are coloured by their amino acid residue at variant positions only. MIC, minimum inhibitory concentration.

