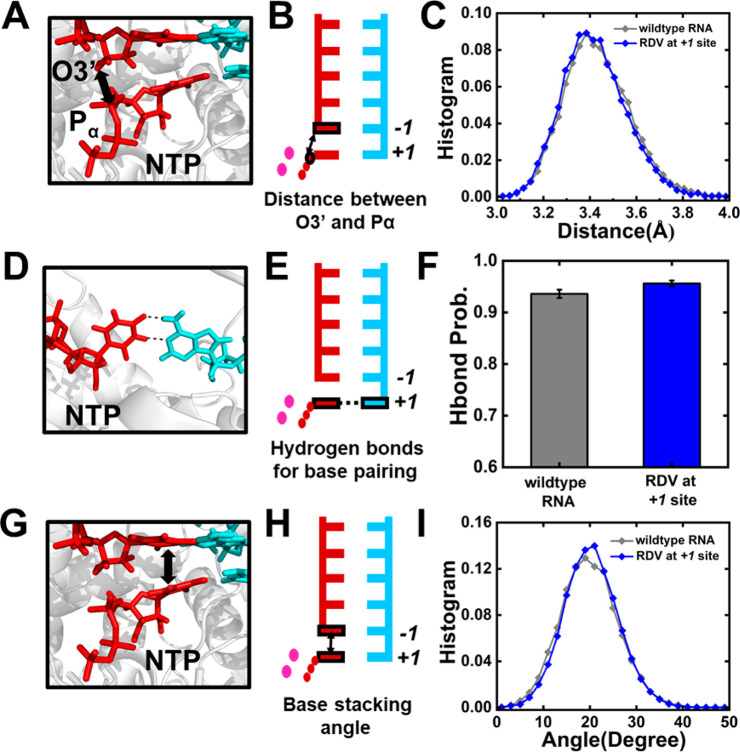
Figure 2.
Investigation into the NTP incorporation capability in SARS-CoV-2 RdRp by 5 × 50 ns simulations. (A,B) 3D structure (A) and cartoon model (B) showing the distance between the Pα atom of the NTP and the O3′ atom of the 3′-terminal nucleotide of the nascent strand. (C) Histogram of the Pα–O3′ distance for two systems including RdRp with wildtype-RNA (gray) and RDV at the +1 site (blue). (D,E) 3D structure (A) and cartoon model (B) showing the hydrogen bond probability for base pairing at the active site. (F) Hydrogen bonding probability for the two systems. (G,H) 3D structure (G) and cartoon model (H) showing the stacking angle between the base of NTP and the base of the 3′-terminal nucleotide. The stacking angle was defined as the angle formed by the normal vectors of the base of NTP and the base of the 3′-terminal nucleotide of the nascent strand. (I) Histogram of the stacking angles in two systems.

