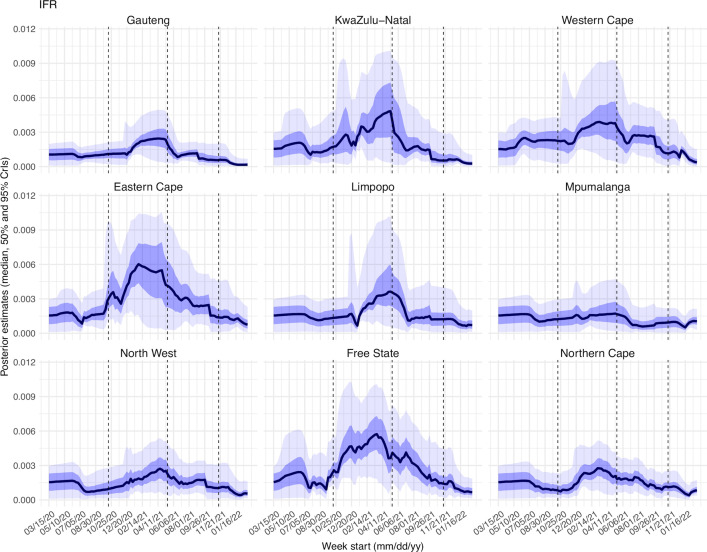
Appendix 1—figure 23. Posterior estimates for infection-fatality risk ( in the observation model) by week.
Thick black lines show the median, dark blue areas show the 50% CrIs, and light blue areas show the 95% CrIs. For reference, the dashed vertical black lines indicate three dates (mm/dd/yy), i.e., 10/15/20, 5/15/21, and 11/15/21, roughly the start of the Beta, Delta, and Omicron waves, respectively.

