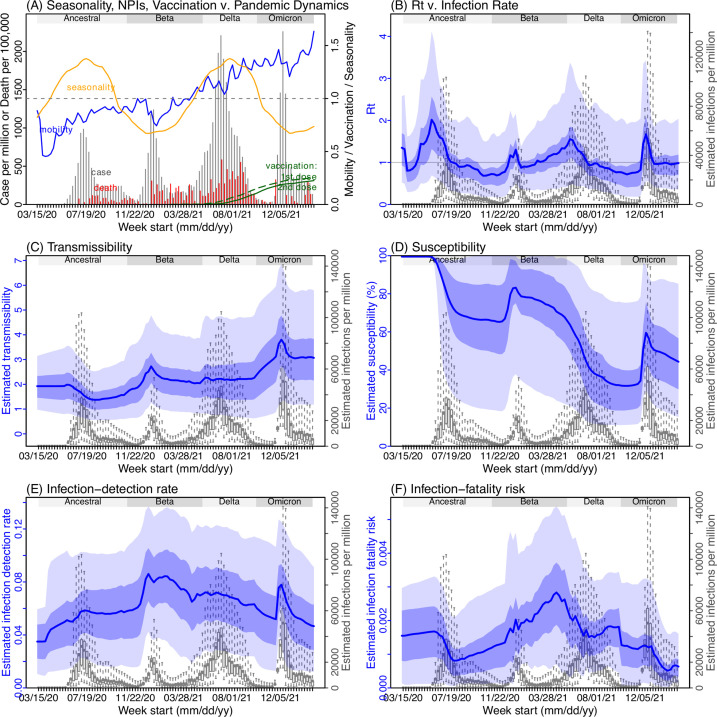
Appendix 1—figure 9. Model inference estimates for North West.
(A) Observed relative mobility, vaccination rate, and estimated disease seasonal trend, compared to case and death rates over time. Key model-inference estimates are shown for the time-varying effective reproduction number Rt (B), transmissibility RTX (C), population susceptibility (D, shown relative to the population size in percentage), infection-detection rate (E), and infection-fatality risk (F). Grey shaded areas indicate the approximate circulation period for each variant. In (B) – (F), blue lines and surrounding areas show the estimated mean, 50% (dark) and 95% (light) CrIs; boxes and whiskers show the estimated mean, 50% and 95% CrIs for estimated infection rates. Note that the transmissibility estimates (RTX in C) have removed the effects of changing population susceptibility, NPIs, and disease seasonality; thus, the trends are more stable than the reproduction number (Rt in B) and reflect changes in variant-specific properties. Also note that infection-fatality risk estimates were based on reported COVID-19 deaths and may not reflect true values due to likely under-reporting of COVID-19 deaths.

