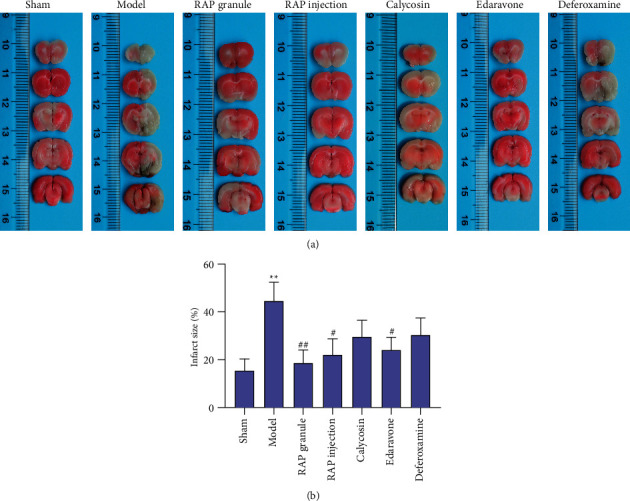
Figure 3.

Effect of RAP on cerebral infarct size in rats after CIRI induced by MCAO determined by TTC staining. (a) One representative image of each of the seven groups is shown; (b) Statistical results of cerebral infarct size in the seven groups (n = 5). ∗∗P < 0.01 vs. sham group, #P < 0.05, ##P < 0.01 vs. model group.
