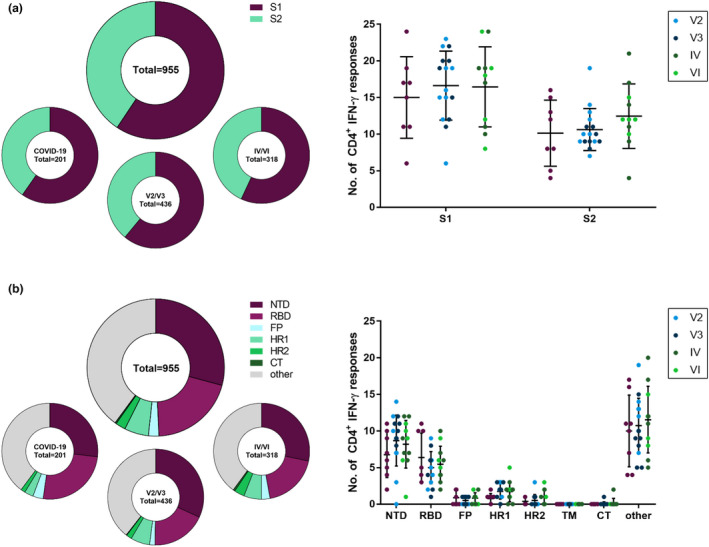
Figure 2.

Distribution of peptide‐specific CD4+ IFN‐γ T‐cell responses within the subunits and domains of the SARS‐CoV‐2 spike glycoprotein. Distribution of CD4+ IFN‐γ T‐cell responses in the S1 and S2 subunits of the spike glycoprotein (a) and the functional domains of the spike glycoprotein (b) were analysed as percentages of all responses and absolute numbers for all study participants and subdivided for the COVID‐19, V2/V3 and IV/VI groups. NTD, N‐terminal domain; RBD, receptor‐binding domain; FP, fusion peptide; HR1, heptapeptide repeat sequence 1; HR2, heptapeptide repeat sequence 2; CT, cytoplasmic tail. Data are expressed as mean with standard deviation.
