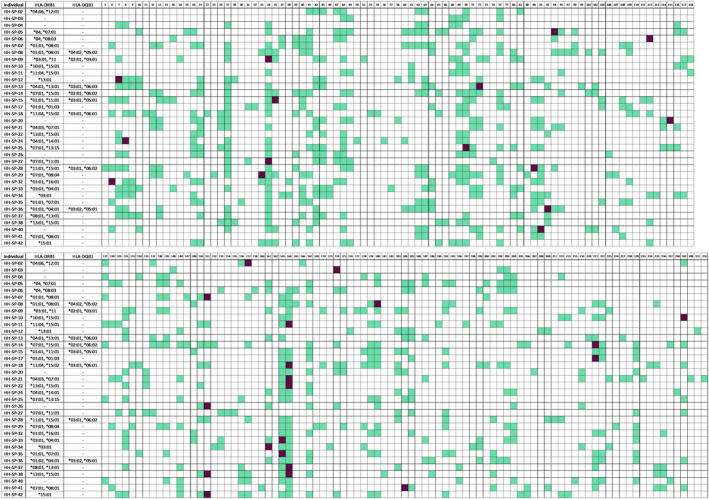
Figure 4.

Individual CD4+ T‐cell response pattern to the spike glycoprotein 15‐mer peptides in the study cohort. The pattern of the CD4+ IFN‐γ T‐cell responses to the 15‐mer peptides of the first (upper panel) and the second half (lower panel) of the 253 15‐mer peptides. Responses are highlighted in green, and the strongest IFN‐γ response of each individual is highlighted in purple. Peptides without any response are not depicted. Bold lines indicate separate peptide pools (S1a–S6b).
