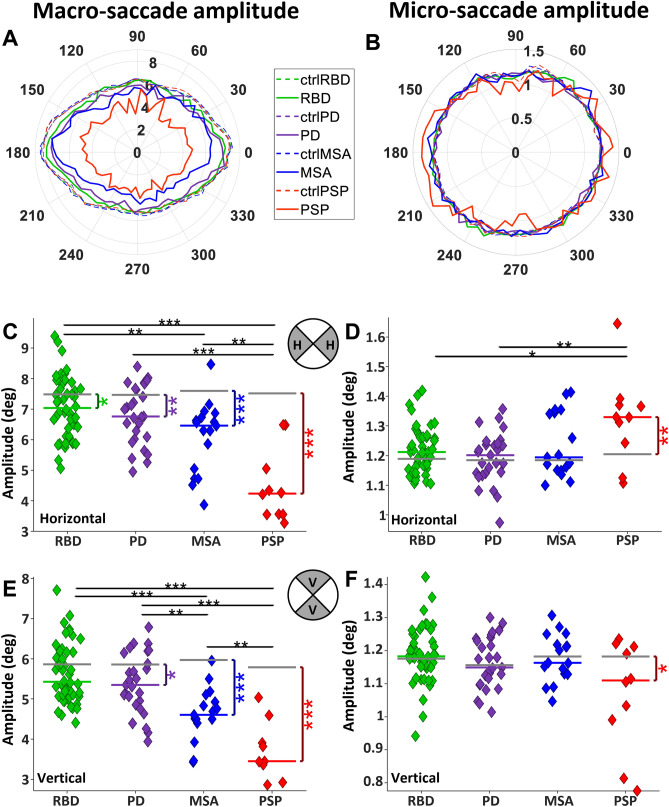
Fig. 4.
Characteristic of saccade amplitude in different directions. A Polar histogram of macro-saccade amplitude, B polar histogram of micro-saccade amplitude for each group. Polar coordinates are saccade directions, and each circle represents the average saccade amplitude within each group. The bin angle was 10 degrees. C and D Horizontal macro- and micro-saccade amplitude, respectively. E and F Vertical macro- and micro-saccade amplitude, respectively

