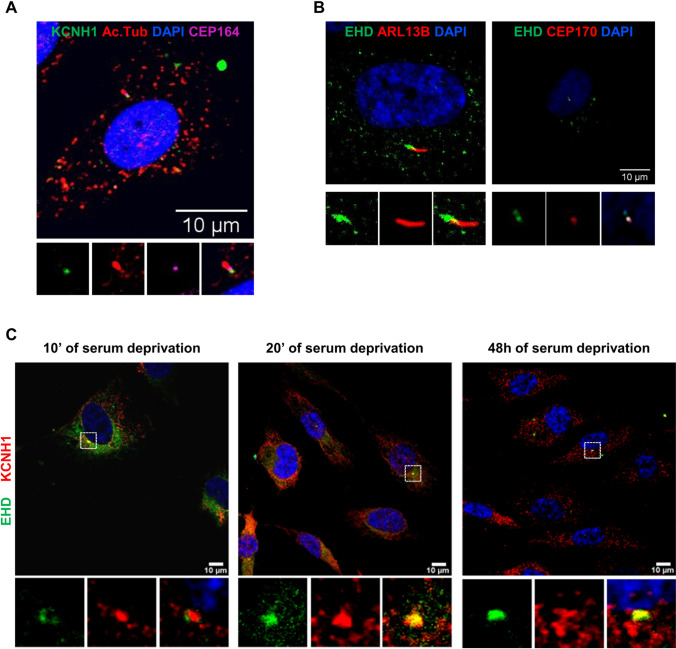
Fig. 1.
KCNH1 localizes to the primary cilia pocket of hTERT RPE-1 cells. (a) Representative images of immunofluorescence (IF) staining detecting KCNH1 localization (green) to the base of the primary cilium. hTERT RPE-1 cells were serum-starved for 48 h and analyzed by IF microscopy. DAPI (blue) was used to visualize nuclei, acetylated tubulin (Ac. Tub) staining (red) detected primary cilium axoneme and CEP164 (pink) the centrosome. Images are maximum intensity projections of z-stacks. Scale bars 10 µm. (b) Representative images of EHD family members 1–4 (green) localization to the ciliary pocket. ARL13B (red) and CEP170 (red) detected respectively primary cilium axoneme and the centrosome. Scale bars 10 µm. (c) Representative images of IF microscopy analysis of colocalization (yellow) between KCNH1 (red) and EHD (green) after 10 min, 20 min, and 48 h of serum deprivation. Scale bars 10 µm

