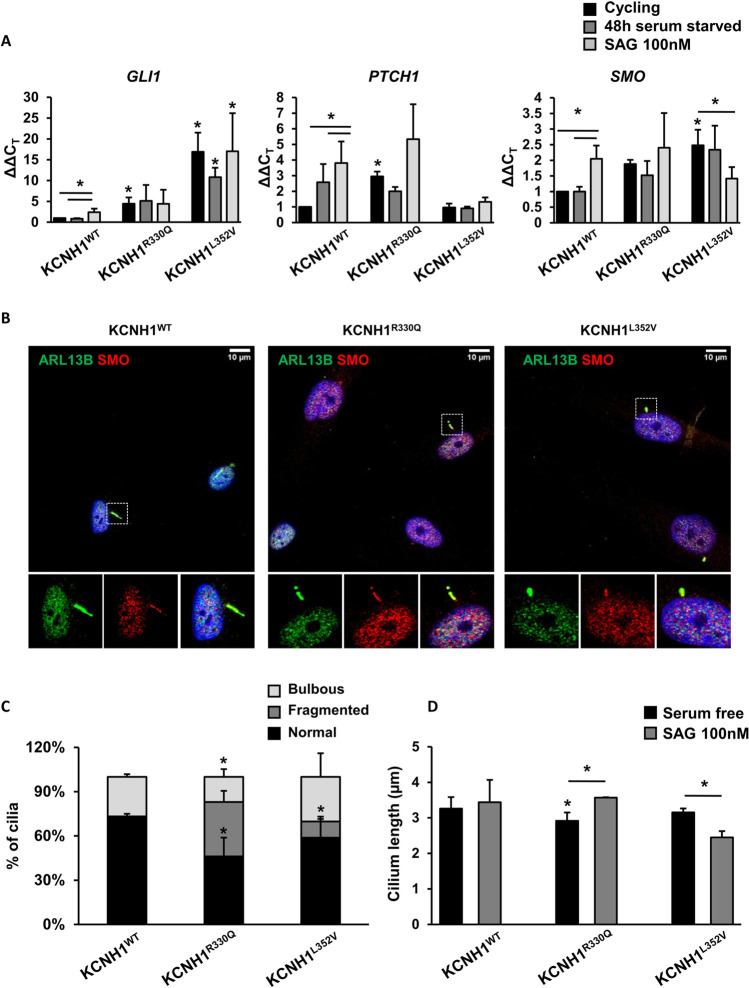
Fig. 5.
KCNH1 mutations induce basal SHH pathway activation. (a) Histograms show the expression levels of target genes of the SHH pathway (GLI1, PTCH1, and SMO) in fibroblasts from patients carrying KCNH1R330Q and KCNH1L352V mutations compared to control cells. Fibroblasts were serum-starved for 48 h and treated with SAG 100 nM. GAPDH was used as a reference gene for normalization. Data are represented as mean + sem. Differences between groups were analyzed by one-tailed Student’s t test. *p < 0.05 is reported vs the same condition of wild-type unless otherwise indicated with bars. (b) Representative images of IF analysis of ciliary localization of SMO (red) and ARL13B (green) in SAG treated wild-type and patients’ fibroblasts carrying KCNH1R330Q and KCNH1L352V mutations. Scale bars 10 µm. (c) Percentage of cells with cilia of different morphology (normal, fragmented, and bulbous). (d) Graph of cilia length measurements of KCNH1WT, KCNH1R330Q, and KCNH1L352V fibroblasts in control and SHH pathway activation condition. Data are represented as mean + sem. Differences between two groups were analyzed by unpaired Student’s t test. *p < 0.05 is reported vs the same condition of wild-type unless otherwise indicated with bars

