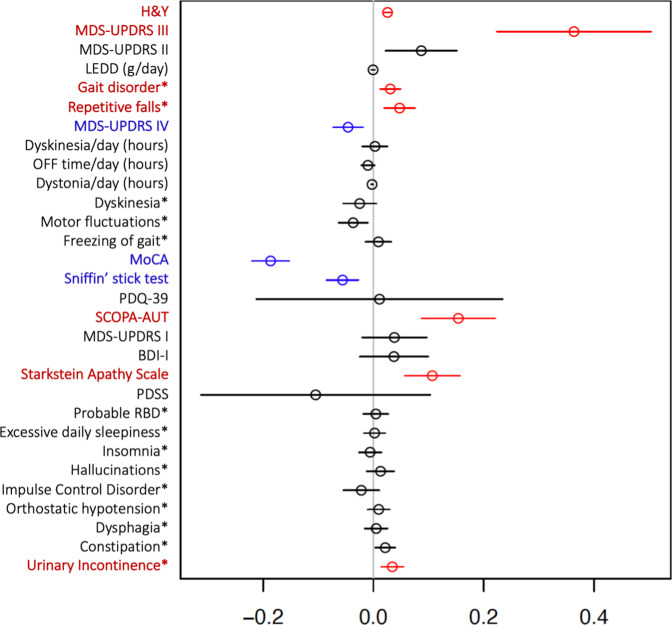
Fig. 1. Forrest plot with estimated coefficients and corresponding confidence intervals (±1.96 × standard error) for AAO, from linear/logistic regression of numerical/binary outcome on disease duration and AAO.
The colour blue indicates significant negative effects of AAO on the clinical outcome, and the colour red indicates significant positive effects at the Bonferroni-adjusted 5% level. The binary variables are annotated by asterisk. Clinical symptoms and scales are described in Supplementary Material.

