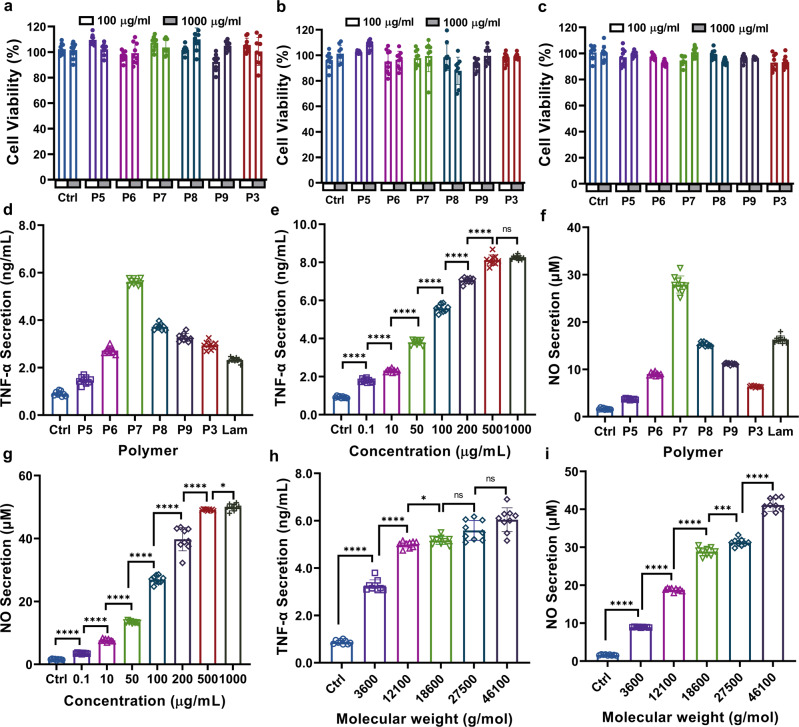
Fig. 5. Cytotoxicity and immunomodulatory activities of (1→6)-β-glucose branched PASs.
Cytotoxicity in a RAW264.7; b HepG2; and c Sarcoma−180 cell lines: 37 °C, 24 h. d TNF-α secretion, polymer concentration: 100 μg/mL, 37 °C, 8 h; e Effect of polymer concentration (P7, FB 30%) on TNF-α secretion: 37 °C, 8 h. Two-tailed unpaired t test were performed Ctrl vs 0.1 (p < 0.0001), 0.1 vs 10 (p < 0.0001), 10 vs 50 (p < 0.0001), 50 vs 100 (p < 0.0001), 100 vs 200 (p < 0.0001), 200 vs 500 (p < 0.0001), 500 vs 1000 (p = 0.2078); f NO secretion, polymer concentration: 100 μg/mL, 37 °C, 24 h; g Effect of polymer concentration (P7, FB 30%) on NO secretion, polymer concentration: 100 μg/mL, 37 °C, 24 h. Two-tailed unpaired t test were performed Ctrl vs 0.1 (p < 0.0001), 0.1 vs 10 (p < 0.0001), 10 vs 50 (p < 0.0001), 50 vs 100 (p < 0.0001), 100 vs 200 (p < 0.0001), 200 vs 500 (p < 0.0001), 500 vs 1000 (p = 0.0346); h Effect of Mn (FB 30%) on TNF-α secretion, polymer concentration: 100 μg/mL, 37 °C, 8 h. Two-tailed unpaired t test were performed Ctrl vs 3600 (p < 0.0001), 3600 vs 12,100 (p < 0.0001), 12,100 vs 18,600 (p < 0.0001), 18600 vs 27,500 (p = 0.0136), 27,500 vs 46,100 (p = 0.0521); i Effect of Mn (FB 30%) on NO secretion, polymer concentration: 100 μg/mL, 37 °C, 24 h. Two-tailed unpaired t test were performed Ctrl vs 3600 (p < 0.0001), 3600 vs 12,100 (p < 0.0001), 12,100 vs 18,600 (p < 0.0001), 18,600 vs 27,500 (p = 0.0002), 27,500 vs 46,100 (p < 0.0001). Unless otherwise stated, data are means ± SD of three independent experiments (N = 3), and triplicates (n = 3) per condition are used in each experiment. ns p > 0.05, *p ≤ 0.05, **p ≤ 0.01, ****p ≤ 0.0001 compared to control (a, c) or adjacent treatment group using two-tailed unpaired t test. Abbreviations used: Ctrl = Control.

