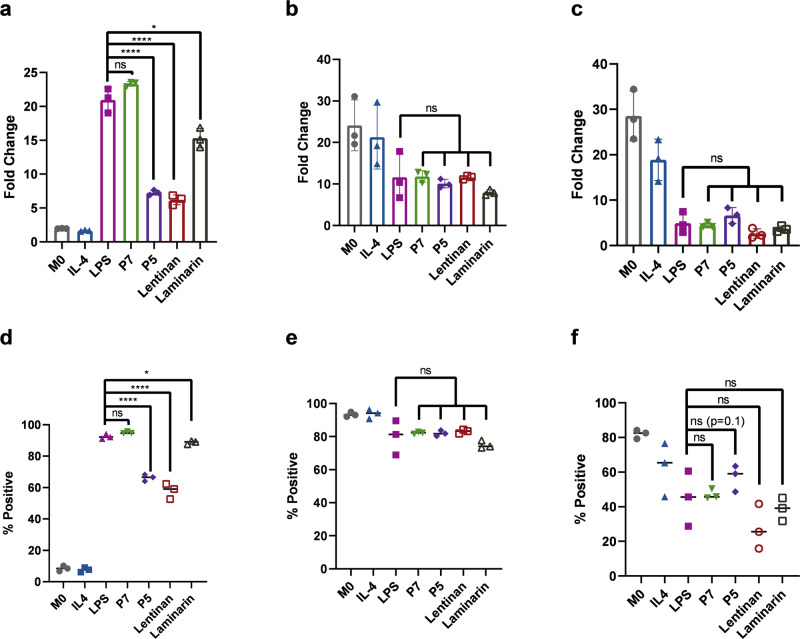
Fig. 7. Primary macrophage expression of M1 and M2 polarization markers evaluated by flow cytometry after treatment with medium only, IL-4, LPS, P7, P5, Lent, or Lam.
Fold change of median fluorescence intensity of a CD80, b CD206, and c CD163 compared to an unstained control. Two-tailed unpaired t test were performed for a LPS vs P5 (p = 0.0002), LPS vs Lentinan (p = 0.0002), LPS vs Laminarin (p = 0.0132). Percentage of positive cells of d CD80, e CD206, and f CD163 compared to an unstained control. Error bars represent standard deviation. Two-tailed unpaired t test were performed for d LPS vs P5 (p < 0.0001), LPS vs Lentinan (p = 0.0003), LPS vs Laminarin (p = 0.0296). Unless otherwise stated, data are means ± SD of three separate experiments (N = 3). ns p > 0.05, *p < 0.05, ****p ≤ 0.0001 compared using two-tailed unpaired t test. Abbreviations used: Ctrl = Control, Dex = Dextran, Lent = Lentinan, Lam = Laminarin.

