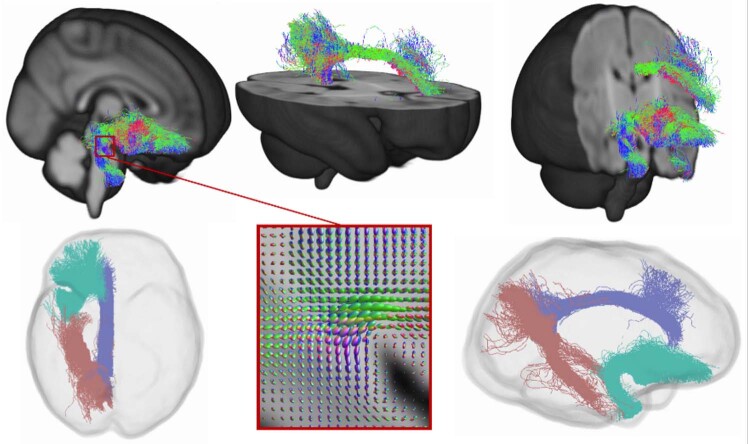
Fig. 1. Visual representation of the tracts in template space.
The top row shows the location of the tracts, coloured by streamline orientation (blue: superior-inferior, red: left-right, green: anterior-posterior). On the bottom row, the middle image shows an example of fibre orientation distributions in a region of crossing fibres, while the left and right images represent “glass-brain” illustrations of the tracts of interest (pink: ventral cingulum, purple: dorsal cingulum, turquoise: uncinate fasciculus).

