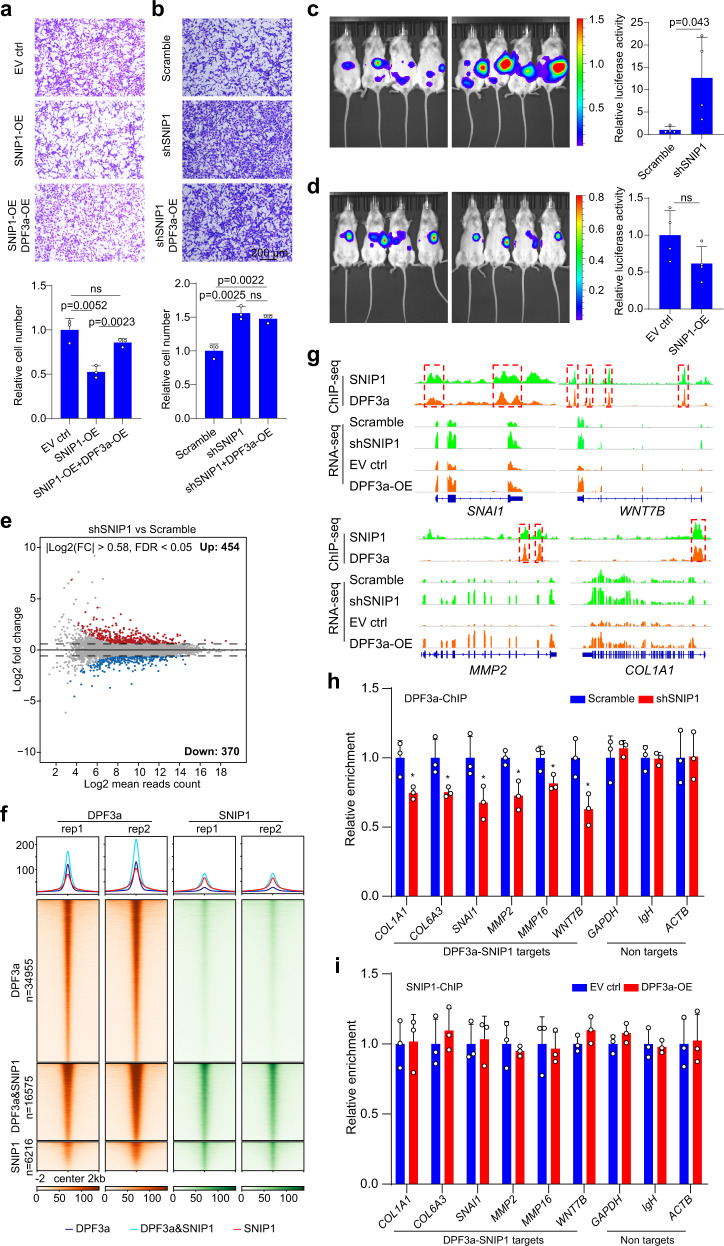
Fig. 5. Co-regulation of cell migration-related genes by DPF3a and SNIP1.
a, b The migration ability of 786-O cells after SNIP1 knockdown/overexpression as well as SNIP1 knockdown/overexpression together with DPF3a overexpression was measured using Transwell assay. Data were presented as mean values ± SD (n = 3 independent experiments). Statistical significance was estimated using a two-sided student t-test. Scale bar, 200 μm. c, d The metastatic ability of 786-O cells with SNIP1 knockdown and overexpression was measured using a mouse metastasis model. Tumor cells expressing luciferase were visualized with d-Luciferin as substrate using an in vivo imaging system. Total luminescence intensity was quantified and statistical significance was estimated using a two-sided student t-test. Data were presented as mean values ± SD (n = 4 animals). e The MA plot comparing the gene expression profile of 786-O cells with and without SNIP1 knockdown. The x-axis and y-axis represent Log2 (mean read counts) and Log2 (fold change), respectively. Red dots indicate upregulated genes, whereas blue dots indicate downregulated genes. The results represent two independent biological replicates. f Genome-wide co-occupancy of DPF3a and SNIP1. Average profiles and heatmaps of normalized read density of ChIP-seq for DPF3a and SNIP1 are presented. The results represent two independent biological replicates for each ChIP-seq experiment. g Genome browser view of ChIP-seq and RNA-seq normalized read counts at SNAI1, MMP2, COL1A1, and WNT7B loci. Co-binding regions of DPF3a and SNIP1 are marked with a red dashed box. h DPF3a ChIP experiments were performed in DPF3a-OE cells after SNIP1 knockdown and DPF3a enrichment at selected genes was quantified by qPCR. Data were presented as mean values ± SD (n = 3 independent experiments). Statistical significance was estimated using a two-sided student t-test (*p < 0.05). pCOL1A1 = 0.029, pCOL6A3 = 0.037, pSNAI1 = 0.046, pMMP2 = 0.016, pMMP16 = 0.036, pWNT7B = 0.023. i SNIP1 ChIP-qPCR was performed to compare its enrichment at selected genes in 786-O cells with and without DPF3a overexpression. Data were presented as mean values ± SD (n = 3 independent experiments). Source data are provided in the Source Data file.

