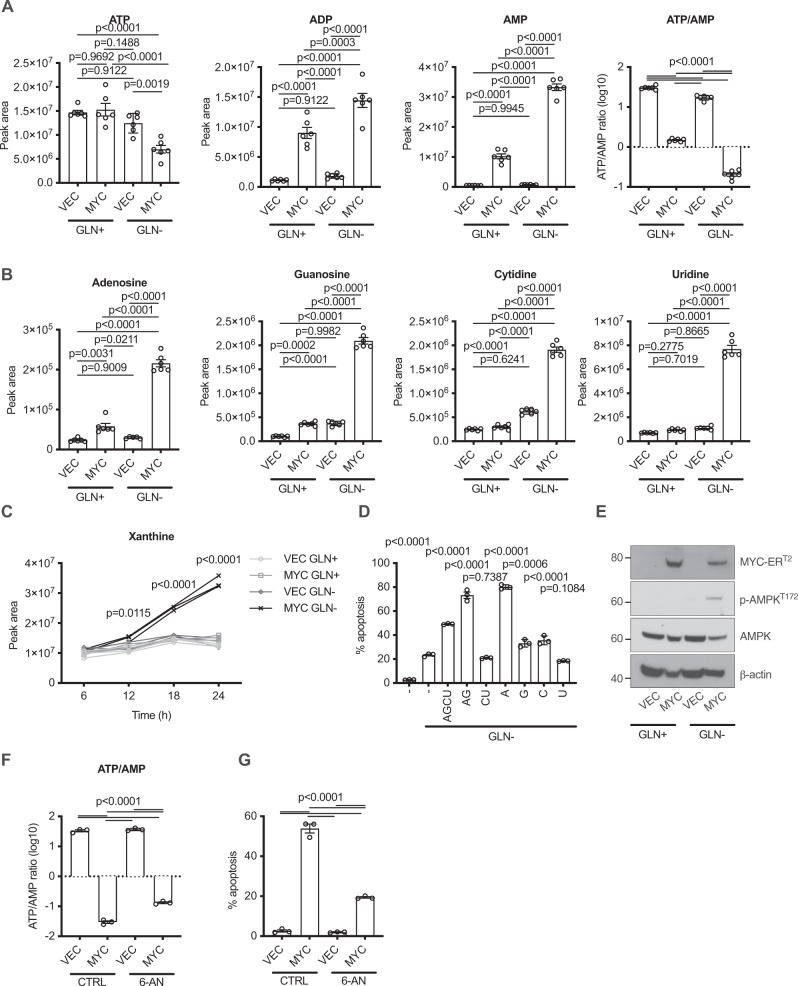
Fig. 3. Energetic crisis and nucleotide catabolism are driven by MYC in the absence of glutamine.
LC-MS was used to quantify levels of metabolites in MRC-5 cells treated for 24 h with 200 nM 4-OHT and then glutamine withdrawal for 16 h. A, B Bar charts show peak intensities of nucleotides, nucleosides, and the ratio of ATP/AMP peak intensities. An ordinary one-way ANOVA was used to determine statistical significance (n = 6 biological replicates, representative of three independent experiments). C Time course of xanthine levels (glutamine withdrawn at time 0). A two-way ANOVA was used to determine statistical significance (n = 3 biological replicates, representative of three independent experiments). D AnnexinV/PI assay of MYC cells with the addition of the indicated nucleosides (1 μM total). Significance is relative to Ctrl—Gln, calculated using an ordinary one-way ANOVA (n = 3). E Western blot for MYC, phospho-AMPK, total AMPK and β-actin. F Ratio of ATP/AMP peak intensities of cells containing MYC-ERT2 (MYC) or vector control (VEC) deprived of glutamine upon inhibition of the PPP with 250 μM 6-AN. An ordinary one-way ANOVA was used to determine statistical significance (n = 3 biological replicates, representative of three independent experiments). G AnnexinV/PI assay on cells as in (F). For all statistical tests P ≤ 0.05 was considered significant, and error bars show the standard error of the mean.

