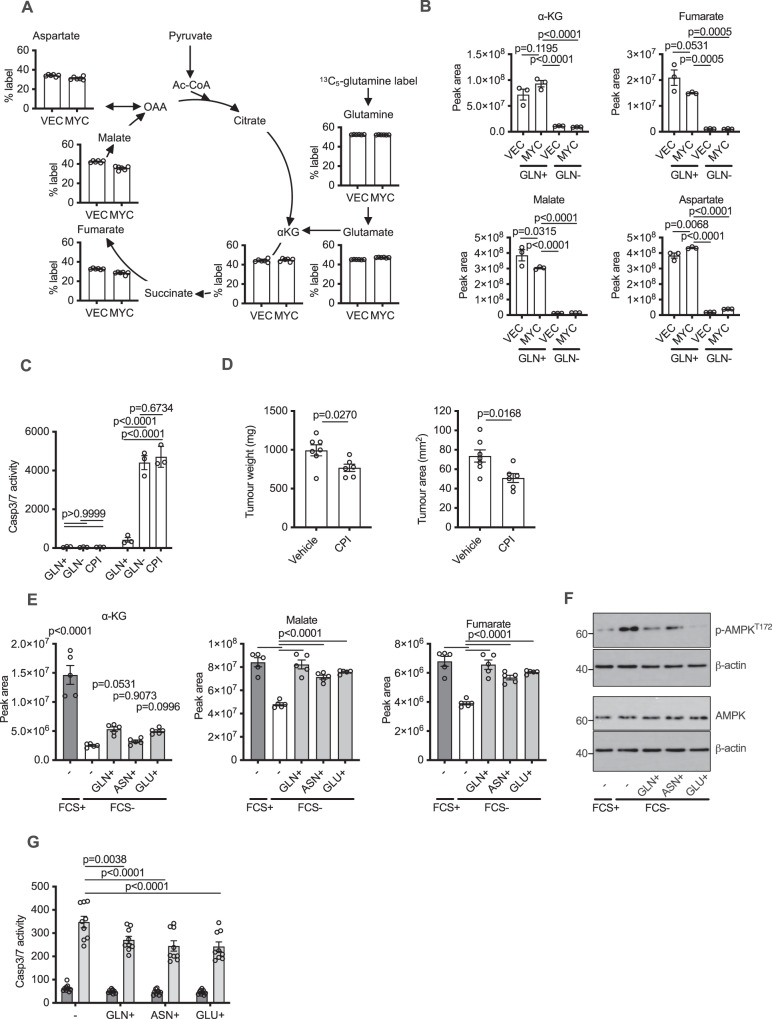
Fig. 5. Loss of TCA cycle triggers MYC-induced apoptosis and reduces tumourigenesis in vivo.
A Percent labelling of the oxidative TCA cycle in MRC-5 cells measured by LC-MS following a 6 h 13C5-glutamine pulse. The predominant oxidative TCA cycle isotopologue (m + 5 or m + 4) is shown for each TCA intermediate. B LC-MS measurement of TCA cycle intermediates. An ordinary one-way ANOVA was used to determine statistical significance (n = 3 biological replicates, representative of three independent experiments). C Incucyte caspase 3/7 apoptosis assay 24 h after treatments shown. CPI = CPI-613. D Weight and tumour area are shown in endpoint tumours from mice injected subcutaneously with 1 × 10⁶ Raji lymphoma cells and treated with vehicle or CPI-613 (20 mg/kg). Statistical analysis was carried out on 6–7 biological replicates using an unpaired two-tailed t test. E Peak areas of indicated metabolites 16 h after FCS withdrawal and with supplementation of indicated amino acids (10 mM). An ordinary one-way ANOVA was used to determine statistical significance (n = 5 biological replicates). F Western blots for phospho-AMPK, total AMPK and β-actin from samples as in (e) but at 16 h. G Incucyte caspase 3/7 apoptosis assay 24 h after treatments shown. An ordinary one-way ANOVA was used to determine statistical significance (n = 9 biological replicates). For all statistical tests, P ≤ 0.05 was considered significant, and error bars show the standard error of the mean.

