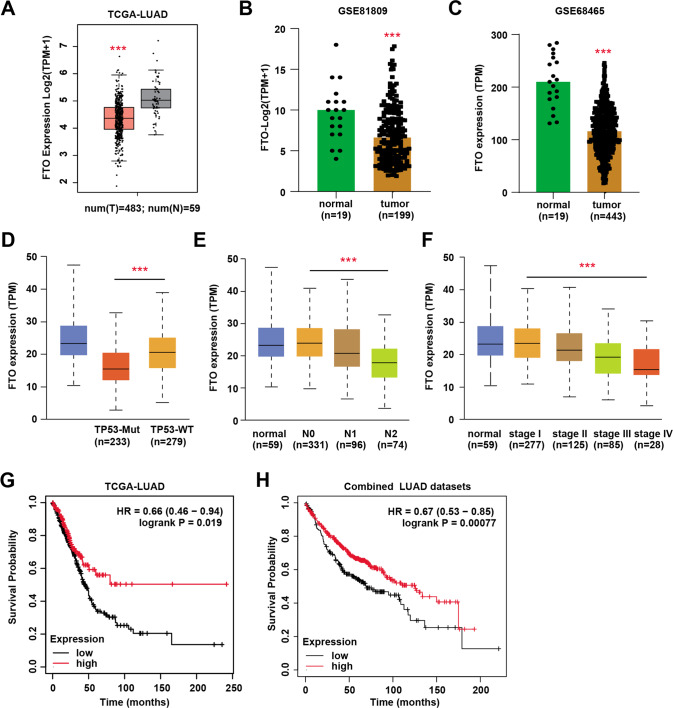
Fig. 4. FTO was down-regulated in LUAD samples and associated with clinical significance in LUAD patients.
A Box plot showing the differential FTO mRNA levels in normal and tumor samples. B Differential analysis of FTO levels in normal and tumor samples based on GSE81809 dataset. C Differential analysis of FTO levels in normal and tumor samples based on GSE68465 dataset. D–F Correlation analysis showing the underlying relationships between FTO levels and clinical phenotypes, including TP53-mutation status (D), lymphatic metastasis (E) and clinicalpathological stages (F). G–H Kaplan–Meier analysis with log-rank test showed that patients with low FTO had poorer OS outcomes relative to those with high FTO expressions based on TCGA-LUAD cohort (G) and combined pan-LUAD datasets (H). Bar = Mean ± SD. *P < 0.05, **P < 0.01, ***P < 0.001.

