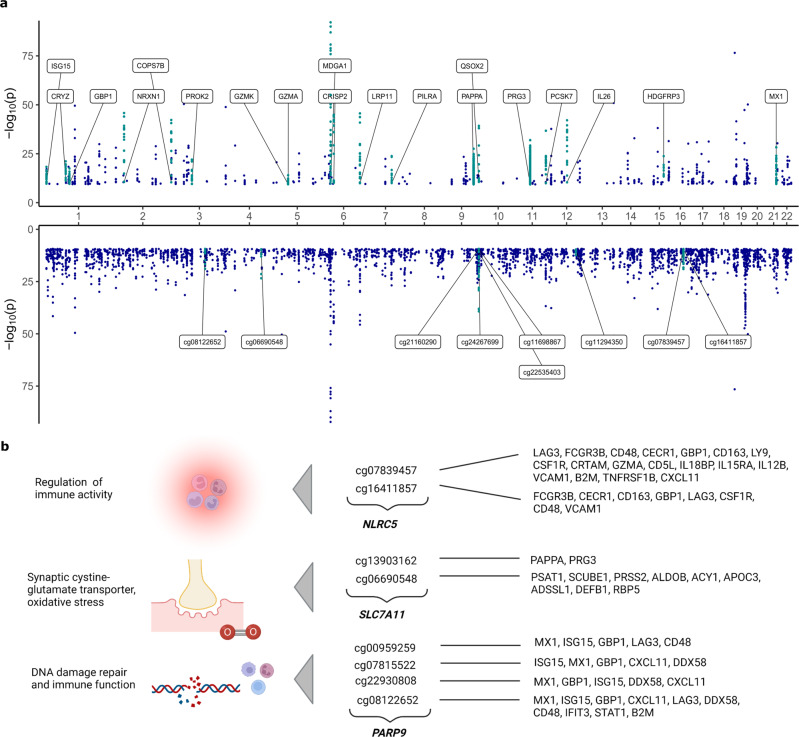
Fig. 3. Pleiotropic associations in the fully-adjusted methylome-wide association studies (MWAS).
a pQTMs that had P < 4.5 × 10⁻¹⁰ (Bonferroni threshold for multiple testing adjustment) in the fully-adjusted MWAS are plotted as individual points (dark blue) with chromosomal locations of the 191 protein genes (upper) and the 1837 CpGs (lower) on the x-axis. 19 proteins with ≥10 associations with CpGs are highlighted in turquoise and labelled on the upper plot. Nine CpGs with ≥6 associations with protein levels are highlighted in turquoise on the lower plot. Results were generated through linear regression models. Full summary statistics with full P values can be accessed in Supplementary Data 6. b A selection of CpGs with highly pleiotropic signals in the fully-adjusted MWAS and the corresponding function of the gene the CpGs were located within. Created with BioRender.com.

