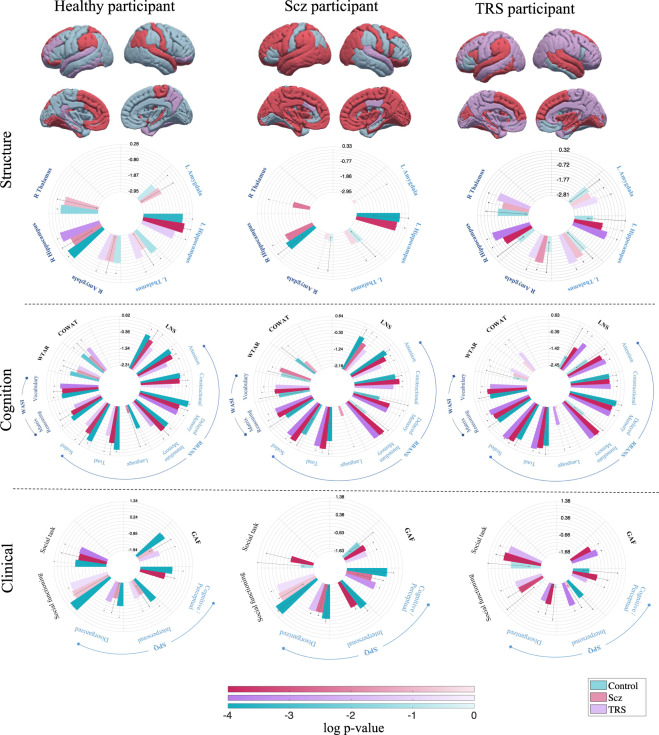
Fig. 1. Exemplar individual-centric affinity fingerprints.
The cortical pattern describes maximal group affinity within each region. In the circular bar graphs, the variable-wise subcortical, cognitive and clinical affinity scores are plotted on the log-scale with 95% confidence intervals (absent bar: zero affinity score, dotted errorbar: zero lower CI). Shading on the bars is based on the log p-value quantifying score reliability. Within each variable, the largest bar corresponds to the group to which the individual shows strongest affinity, followed by the group with second-highest affinity and so on.

