Fig. 1.
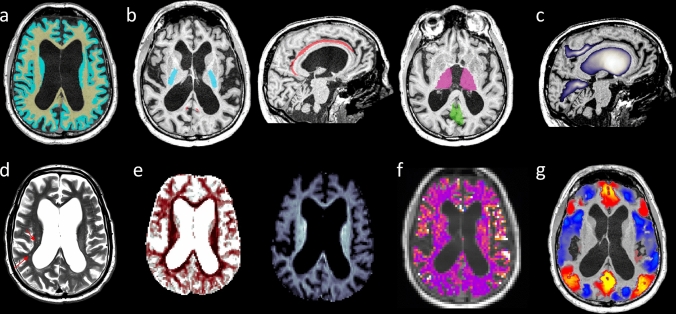
Example of multimodal MR brain imaging for a single iNPH patient. (a) T1-weighted images and superimposed WM (yellow) and GM (light blue) masks. (b) WM and GM regions of interest: posterior limb of the internal capsule (PLIC, light blue); cingulum bundle (CING, red); thalamus (THAL, violet); posterior cingulate cortex (PCC, green). (c) Brain morphology: the blue-to-white colormap represents probability maps for the posterior callosal marginal fissures (PCMF), the ventricles, and the calcarine fissures (CF). (d) T2-weighted axial slice: red arrows indicate WM hyperintensities. (e) ODI (dark red indicates lower ODI values, corresponding to more packed and less fanned out WM fibers) and Vic (lighter blue indicates higher Vic values, corresponding to larger intra-axonal volume fraction) axial slices derived from NODDI reconstruction of DWI data. (f) Relative blood perfusion derived from ASL data superimposed on a T1-weighted slice (yellow-white indicates higher relative perfusion). (g) Standardized rs-fMRI values from a single time point corresponding to PCC activation, superimposed on a T1-weighted slice [yellow–red (light blue) indicates co-activation (co-deactivation) with the PCC; only rs-fMRI values of cortical voxels are shown]

