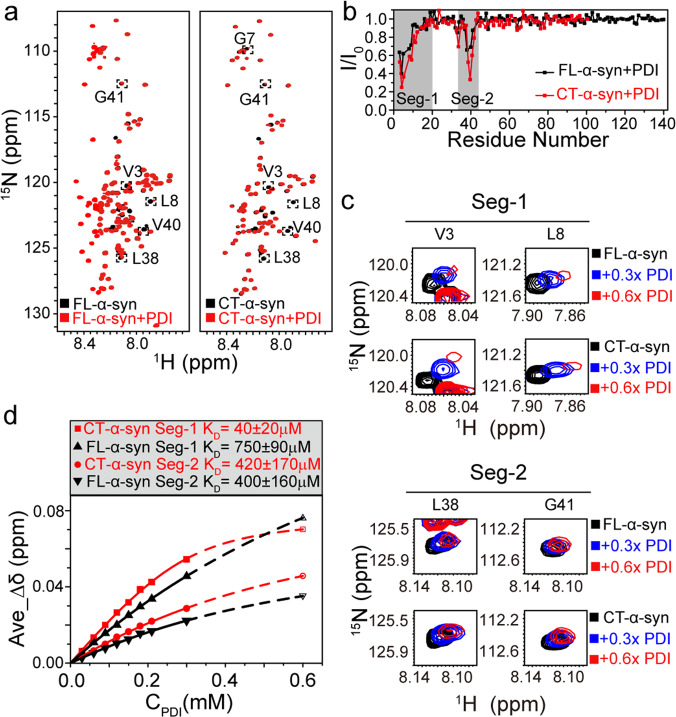
Fig. 2. Stronger interaction of CT-α-syn with PDI.
a Overlay of 1H-15N HSQC spectra of 0.3 mM 15N-enriched FL- and CT-α-syn in the absence (black) and presence (red) of 0.15 mM PDI. Perturbed residues are surrounded by a dotted box. b Residue-resolved signal attenuation (I/I0) of 0.3 mM FL- (black circles) and CT-α-syn (red circles) upon adding 0.15 mM PDI. Values <1.0 indicate interactions. Binding regions are colored gray. c Representative 1H-15N HSQC cross-peaks within segments 1 and 2 of 0.3 mM FL- and CT-α-syn titrated with PDI. d Average CSPs of distinguishable residues within segment 1 (V3, M5, G7, L8, S9, K12, V15, A17, A18, A19, and E20) and 2 (T33, V37, L38, V40, G41, and T44) of FL- and CT-α-syn as a function of the PDI concentration. KD values from curve fitting are shown. CSP values of FL- and CT-α-syn at 0.6 mM PDI were predicted by fitting the curve due to signal attenuation from segments 1 and 2 at higher (>0.3 mM) PDI concentration.

