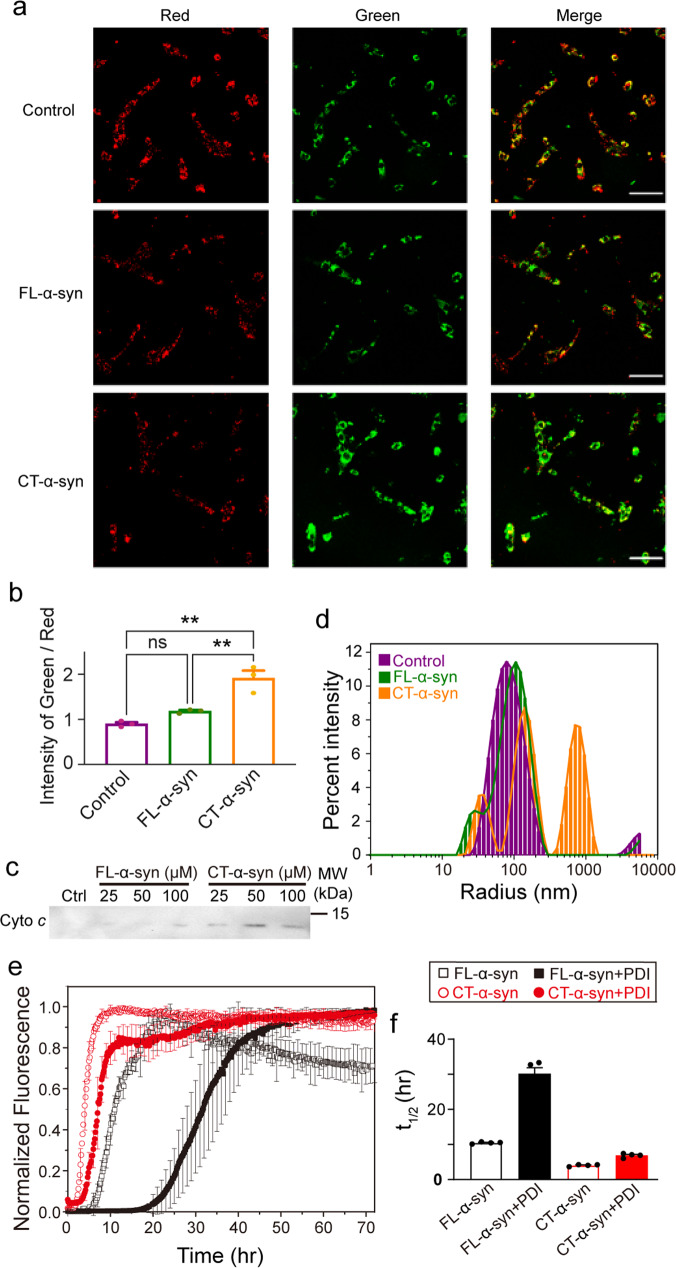
Fig. 4. Physiological and pathological consequences of CT-α-syn.
a Representative confocal images of JC-1-stained SK-N-SH cells after 5 h treatment with 50 μM FL-α-syn and CT-α-syn at 37 °C. Scale bar = 2 μm. b Integrated fluorescence intensities of five random visual fields were analyzed with Image J software using the mean ratio of green to red fluorescence to indicate mitochondrial damage. Uncertainties are the standard error of the mean from three biologically independent experiments. Statistical analysis were performed by one-way ANOVA for multiple comparisons. p < 0.05 was considered statistically significant difference (*p < 0.05; **p < 0.01; ns, not significant). c Cytochrome c levels were assessed by Western blotting after incubating isolated mitochondria with increasing concentrations of FL- and CT-α-syn at 37 °C for 1 h. Unincubated mitochondria served as positive controls. d Dynamic light scattering-measured particle size of POPC/CL (7:3 mole ratio) liposomes alone (purple line), or after incubation with FL- (green line) or CT-α-syn (orange line) for 30 min. e Aggregation kinetics of 0.3 mM FL- and CT-α-syn in the absence and presence of equimolar PDI monitored by thioflavin T fluorescence. f Half-time (t1/2) of aggregation. Uncertainties are the standard error of the mean from four independent experiments.

