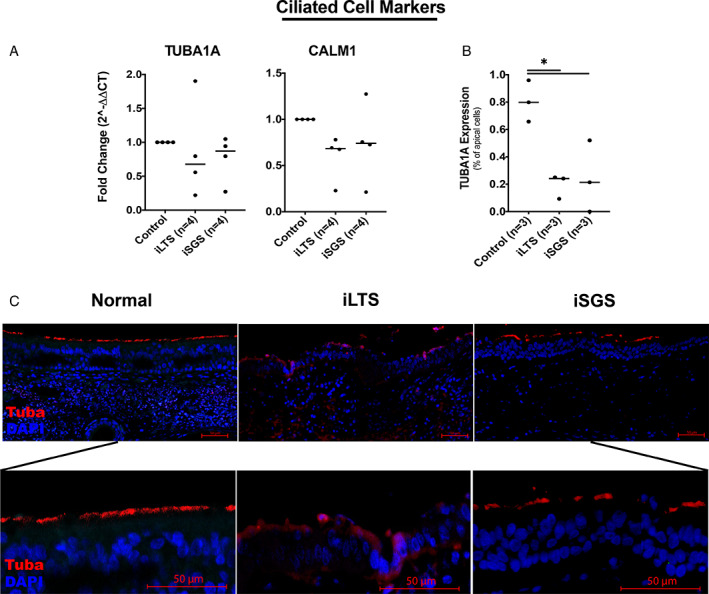
Fig. 4.

Diminished ciliary cells in iSGS and iLTS‐scar—(A) Gene expression for CALM1 and TUBA1A, two ciliary markers, demonstrated no significant differences between groups. (B) Quantitative analysis of immunohistochemical staining demonstrated decreased TUBA1A expression among apical cells in iLTS and iSGS‐scar epithelium compared with non‐scar controls. (C) Representative immunohistochemical staining for TUBA1A (TUBA), and DAPI demonstrating abnormal morphology in iLTS and ISGS‐scar epithelium compared with non‐scar controls; magnified view demonstrating ciliary staining. * = P < .05. [Color figure can be viewed in the online issue, which is available at www.laryngoscope.com.]
