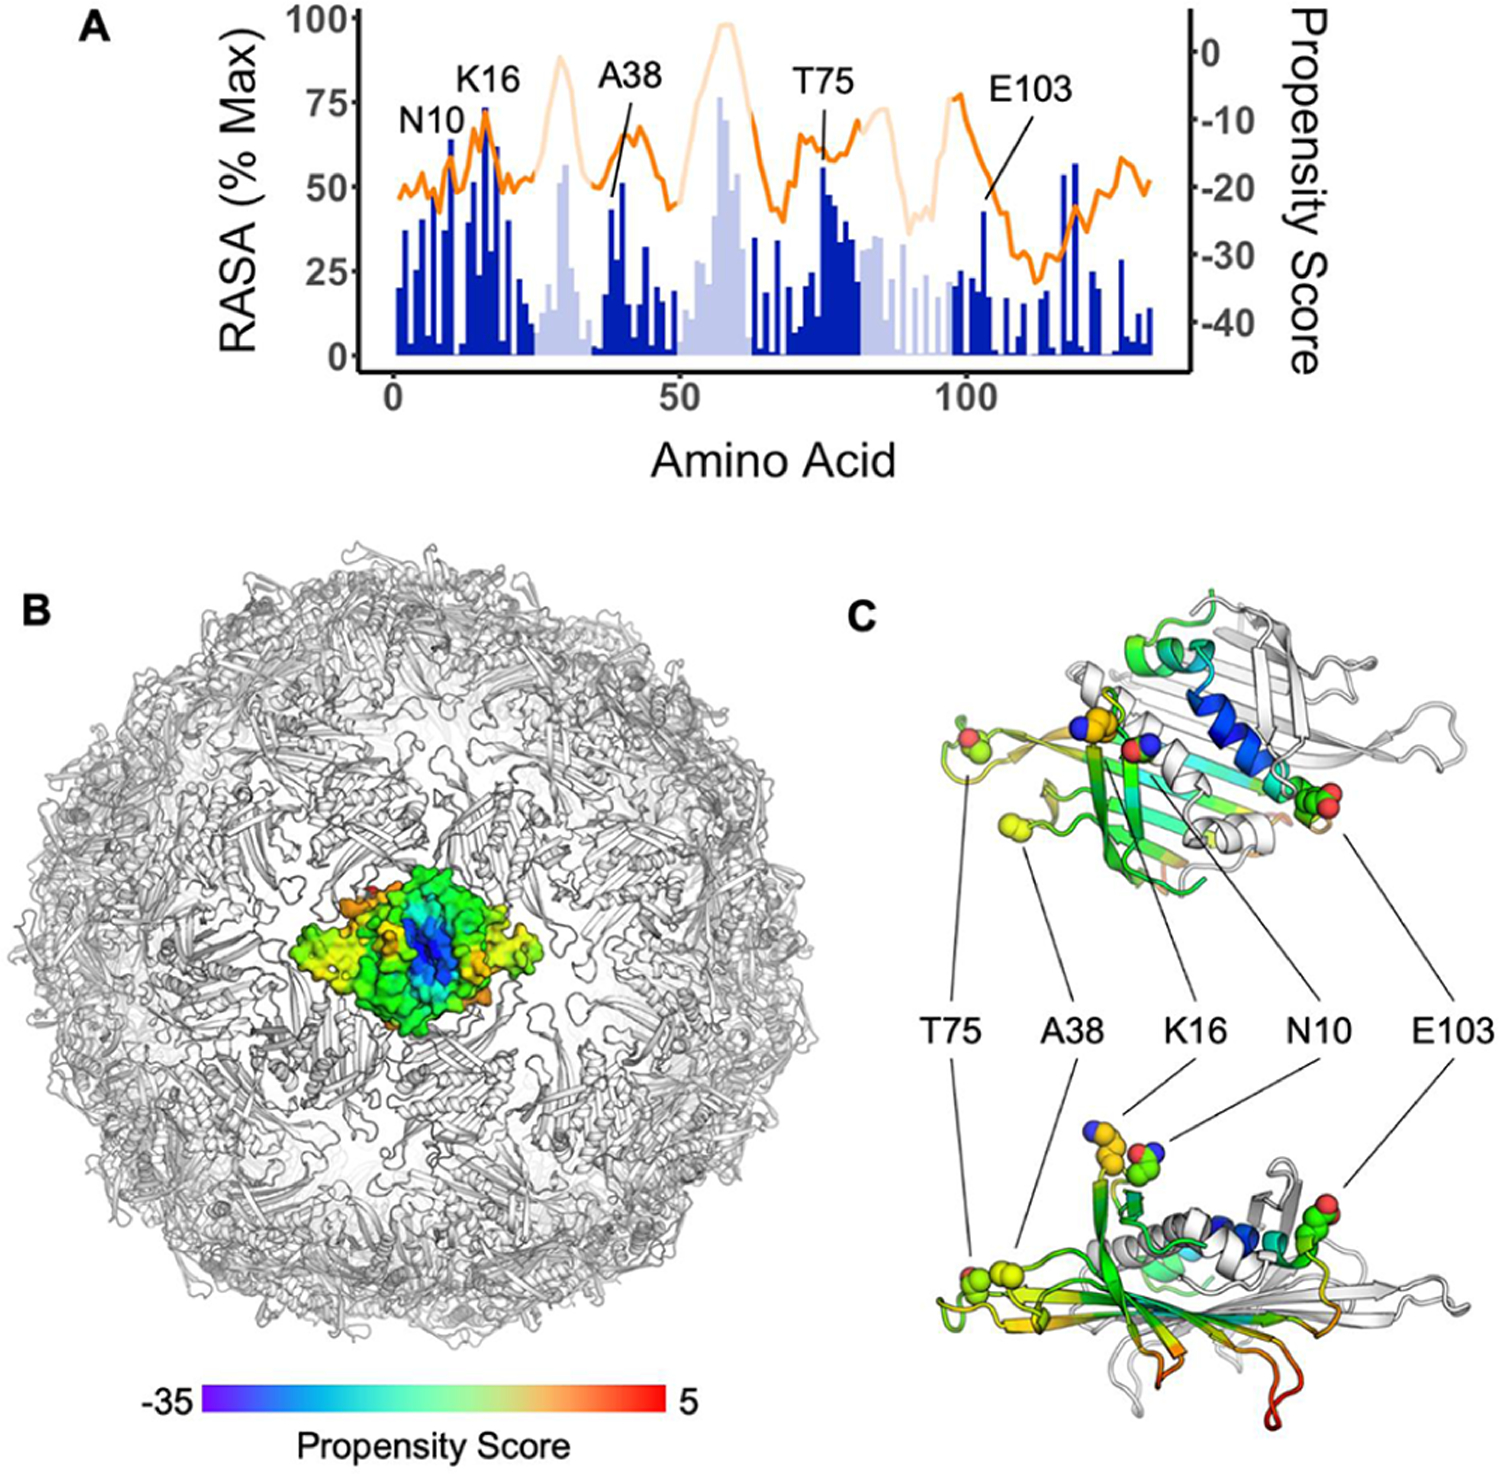
Figure 2.

(A) Relative accessible surface area (RASA, blue) and DiscoTope 2.0 propensity scores (orange) of residues from the Qβ coat protein sequence. Data represent the average of all three chains of the asymmetric unit. Regions facing the exterior of the VLP based on crystal structure analysis are shaded in dark blue color. (B) Propensity scores mapped by color onto coat protein dimer in the context of the full particle based on the particle crystal structure (PDB code 7TJM). Red indicates residues with higher B-cell epitope potential, while blue represents residues with lower B-cell epitope potential. (C) Close-up view of a dimer indicates the locations of surface-exposed and high B-cell propensity residues studied in this work.
