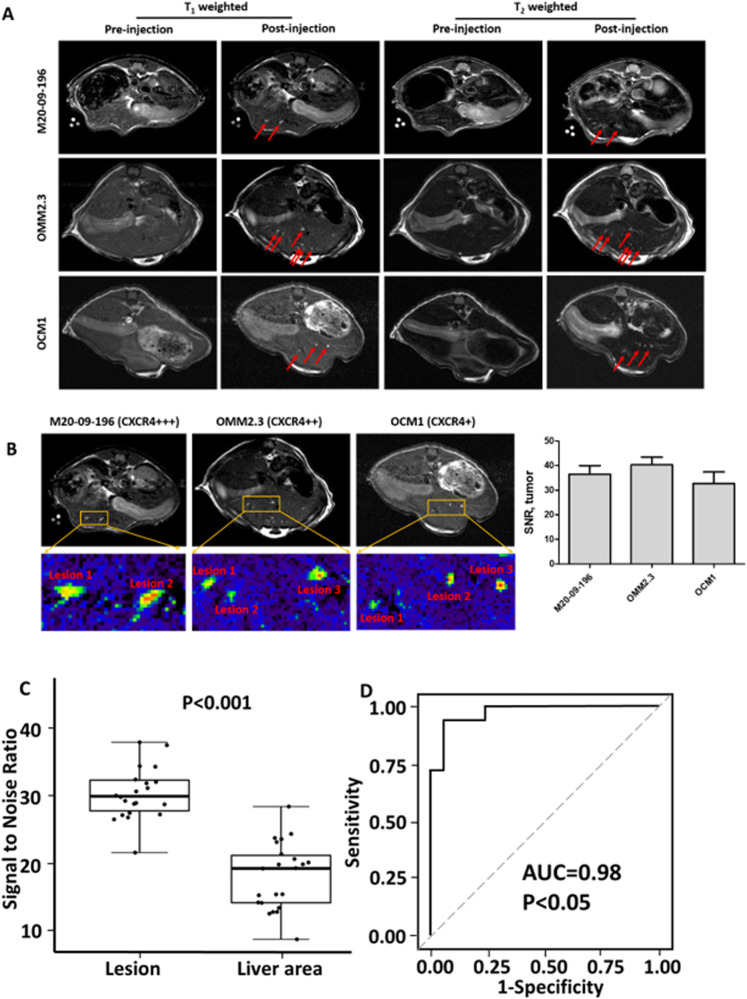
Fig. 5. MR images of metastatic mice models with ProCA32.CXCR4 administration.
A Comparison of MRI images of metastatic mice models including M20-09-196, OMM2.3, and OCM1, before and after administration of ProCA32.CXCR4. Both T1-weighted (left two columns) and T2-weighted (right two columns) MR images showing metastatic lesions, illuminated following the administration of ProCA32.CXCR4. Red arrows point to the UM metastases in the liver. B Zoom-in view of the metastases from M20-09-196, OMM2.3, and OCM1 mouse models; MRI signal-noise-ratio (SNR) of metastases following ProCA32.CXCR4 administration. C The box-and-whisker plot of tumor lesion SNR and liver SNR. The p-value of less than 0.001 generated from student’s T-test indicates a significant difference between tumor SNR and liver SNR. D ROC plot with statistical analysis that suggests ProCA32.CXCR4 provides diagnostic validation for UM metastases in the liver (lesions n = 22, mice n = 4). P < 0.05 indicates the significance.

